The Beast Trader logo – price action trading education and professional trading strategies platform
No Result
View All Result
Tuesday, April 14, 2026
  • Login
  • Register
  • Home
  • Price Action
    • Foundations
      • Basics Of Market
    • Core Price Action Structure
      • Foundations Of Price Action
      • Understandind Support & Resistance like a pro
      • Market Structure & Phases
      • Trending vs Sideways
    • Candlestick Trading Mastery
      • Complete Candlestick Trading Blueprint
      • Advance Candlestick Interpretation
    • High Probability Patterns
      • A. Major Reversal Structure
      • B. Continuation Patterns
      • C. Neutral & Compression Patterns
    • Indicators With Price Action
      • Moving Averages With Price Action
      • Volume Analysis In Price Action
      • RSI & Bollinger Bands Confirmation
    • Professional Trade Management
      • Professional Risk Management Framework
      • Position Sizing Mastery
      • Trailing Stop Techniques
      • Re-Entries & Partial Exits
    • Real Market Applications & Case Studies
  • Indian Stocks
  • Gold & Commodities
  • Markets
  • Forex
  • Calculator
The Beast Trader logo – price action trading education and professional trading strategies platform
  • Home
  • Price Action
    • Foundations
      • Basics Of Market
    • Core Price Action Structure
      • Foundations Of Price Action
      • Understandind Support & Resistance like a pro
      • Market Structure & Phases
      • Trending vs Sideways
    • Candlestick Trading Mastery
      • Complete Candlestick Trading Blueprint
      • Advance Candlestick Interpretation
    • High Probability Patterns
      • A. Major Reversal Structure
      • B. Continuation Patterns
      • C. Neutral & Compression Patterns
    • Indicators With Price Action
      • Moving Averages With Price Action
      • Volume Analysis In Price Action
      • RSI & Bollinger Bands Confirmation
    • Professional Trade Management
      • Professional Risk Management Framework
      • Position Sizing Mastery
      • Trailing Stop Techniques
      • Re-Entries & Partial Exits
    • Real Market Applications & Case Studies
  • Indian Stocks
  • Gold & Commodities
  • Markets
  • Forex
  • Calculator
No Result
View All Result
The Beast Trader logo – price action trading education and professional trading strategies platform
No Result
View All Result
Home Price Action Foundations Basics Of Market

How I Make Profit in the Market: Stock, Gold, Crypto & Forex Trading Explained for Beginners

by Arvind Singh
March 16, 2026
in Basics Of Market, Foundations, Price Action
0
Infographic explaining how to make profit in the financial market using trading strategies, price action and risk management for beginners

Making profit in the financial market requires understanding price action, market trends, risk management, and disciplined trading strategies.

153
SHARES
1.9k
VIEWS
Share on FacebookShare on TwitterShare on WhatsApp

Whenever someone new enters the world of trading, the first thing they usually hear is this:

“Buy a share today, wait for the price to increase, and then sell it to make profit.”

At first glance, this sounds simple and logical. But after spending years observing markets and interacting with traders, I realized something important:

The market does not only reward people when prices go up.

In reality, money can be made when prices go up, down, or even move sideways — if you understand how price movement actually works.

In this article, I want to explain the same concept the way I explain it to beginners — in a simple, practical way, using examples from stocks, gold, cryptocurrency, and forex currency pairs.

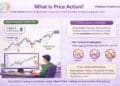
Understanding How Prices Actually Move in the Market

Infographic explaining why prices move in financial markets based on demand and supply imbalance between buyers and sellers
Prices in financial markets move because of the imbalance between demand and supply. When demand from buyers increases, prices rise, and when supply from sellers increases, prices fall.

Before we talk about profit, we first need to understand why prices move at all.

Markets are nothing more than a constant interaction between buyers and sellers.

From my experience, price movement usually falls into three simple situations.

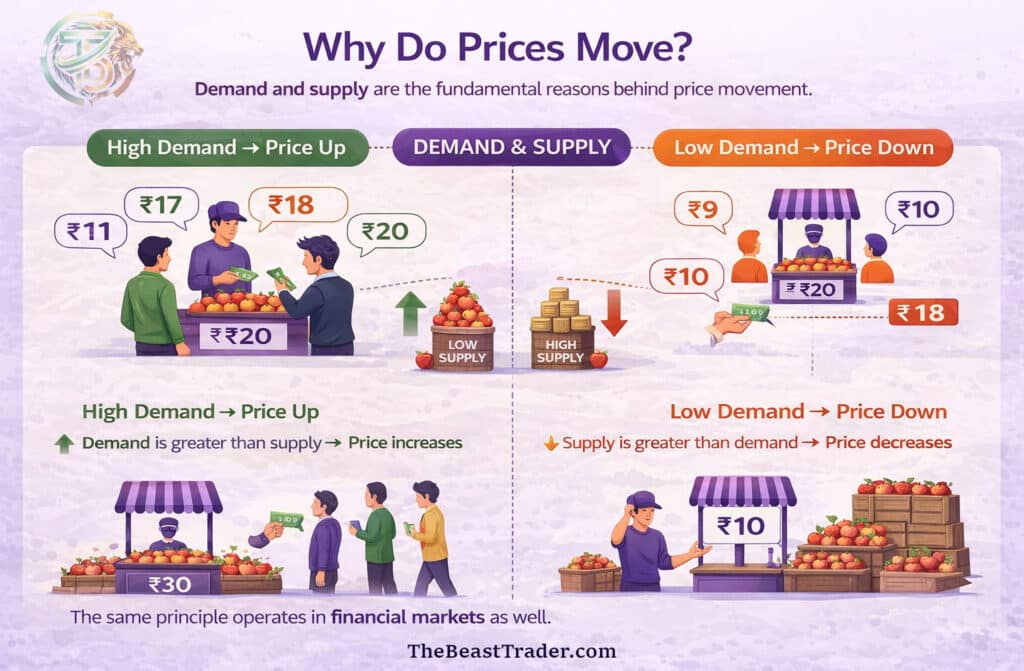
1. When Buyers Dominate the Market

If a large number of traders want to buy an asset — whether it is Reliance shares, Bitcoin, or Gold — demand increases.

And whenever demand increases, prices rise.

For example:

If many investors suddenly start buying Bitcoin, its price might move from $50,000 to $55,000 simply because buyers are dominating the market.

2. When Sellers Dominate the Market

On the other hand, if traders start selling aggressively, supply increases.

And when supply increases, prices fall.

For example:

If institutional traders start selling Gold futures, the price might drop from ₨. 60,000 to ₨.58,000 per 10 grams.

The reason is simple — there are more sellers than buyers.

3. When Buyers and Sellers Are Balanced

Sometimes neither buyers nor sellers dominate the market.

In that situation, the price simply moves sideways.

This happens very often in:

  • Forex currency pairs like EUR/USD
  • Consolidating stocks
  • Range-bound crypto markets

During these phases, the market waits for new information or strong momentum before deciding its next direction.

The Hidden Force Behind Market Movement

Infographic illustrating the hidden forces behind market movements including institutional traders, market psychology, and price manipulation
Market movements are often driven by large institutional traders, liquidity, and market psychology that influence buying and selling pressure.

One thing many beginners underestimate is market psychology.

Markets are driven by human emotions.

  • Optimism creates bullish trends
  • Fear creates bearish trends
  • Uncertainty creates sideways markets

When thousands of traders act together, their collective behavior becomes surprisingly predictable.

This is why experienced traders often focus on identifying moments when other traders are under stress.

Because stress often creates powerful trading opportunities.

How I Make Money When Prices Go Up (Long Position)

Infographic explaining how to make profit in the financial market using trading strategies, price action and risk management for beginners
Making profit in the financial market requires understanding price action, market trends, risk management, and disciplined trading strategies.

Let’s start with the most common strategy.

Suppose I analyze a stock like Infosys and believe its price will increase.

Today the stock is trading at ₨1,450.

I buy the stock and hold it.

In trading language, we call this going long.

If the price rises to ₨1,520, I sell it.

My profit becomes:

₨1,520 – ₨1,450 = ₨70 per share

This type of trade is called a long trade.

But here is something many beginners don’t know.

How I Make Profit When the Market Falls (Short Selling)

A falling market does not mean profit opportunities disappear.

In fact, many professional traders love falling markets.

Because they use a concept called short selling.

Short selling simply means:

Sell first, buy later.

A Simple Real-Life Example

Let me explain this with a very simple situation.

Suppose my friend Arjun wants to sell his gaming laptop for ₨55,000.

At the same time, another friend Vikram wants to buy a similar laptop.

So I tell Vikram:

“I can arrange this laptop for you for ₨65,000.”

He agrees and gives me an advance.

Now I buy the laptop from Arjun for ₨55,000 and deliver it to Vikram.

My profit becomes:

₨65,000 – ₨55,000 = ₨10,000

Notice something interesting.

I did not own the laptop initially, yet I still made a profit by connecting the buyer and seller.

This is exactly how short selling works in financial markets.

Short Selling Example in the Stock Market

Suppose a stock like HDFC Bank is trading at ₨1,600.

After analyzing the trend, I believe the price may fall to ₨1,520.

Instead of buying the stock, I sell it first at ₨1,600.

Later, when the price falls to ₨1,520, I buy it back.

Profit:

₨1,600 – ₨1,520 = ₨80 per share

This entire process happens in intraday trading.

The Same Concept Works in Gold, Crypto and Forex

The beautiful thing about financial markets is that the same logic applies everywhere.

Gold Trading

If Gold is trading at ₨60,000 and I believe it will fall, I can short it.

If it falls to ₨59,200, the difference becomes profit.

Crypto Trading

Suppose Ethereum is trading at $3,000.

If I short Ethereum and the price drops to $2,700, I profit from the decline.

Crypto exchanges allow traders to short using futures or margin trading.

Forex Trading

In forex trading, this concept is even more natural.

When trading USD/JPY or EUR/USD, you are always:

  • buying one currency
  • selling another currency

So traders constantly take both long and short positions.

Intraday Trading vs Long-Term Investing

There are two main ways people participate in markets.

Infographic comparing intraday trading vs long term investing showing short term trading strategy and long term investment growth
Intraday trading focuses on short-term price movements within a single day, while long-term investing aims to build wealth over time through holding assets.

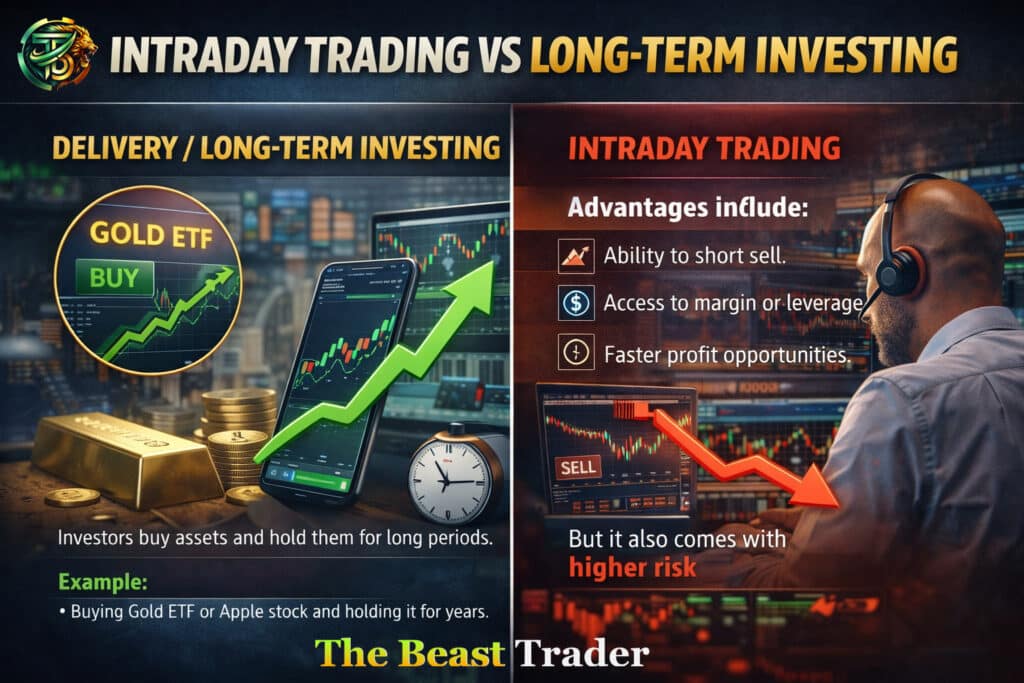
Delivery / Long-Term Investing

Investors buy assets and hold them for long periods.

Example:

Buying Gold ETF or Apple stock and holding it for years.

Intraday Trading

Traders open and close positions within the same trading day.

Advantages include:

  • Ability to short sell
  • Access to margin or leverage
  • Faster profit opportunities

But it also comes with higher risk.

The Four Elements of a Strong Trading Edge

After observing thousands of trades, I believe consistent profit requires a strong trading edge.

This edge usually comes from four key elements.

Infographic explaining the four elements of a strong trading edge including strategy, risk management, trading psychology and discipline
A strong trading edge is built on four key elements: a clear trading strategy, proper risk management, disciplined execution, and strong trading psychology.

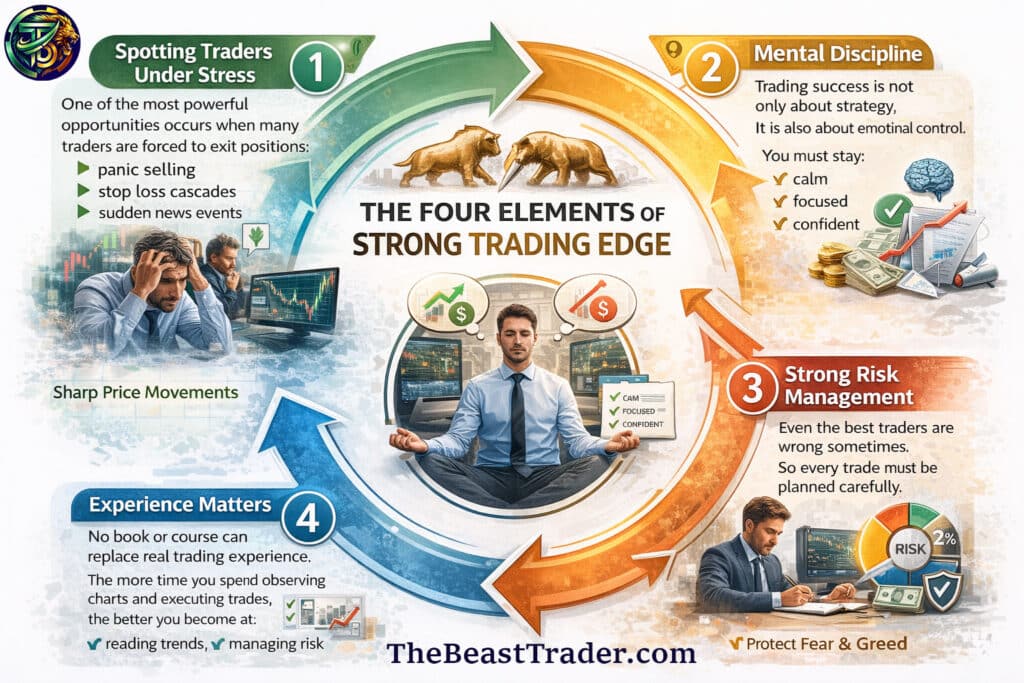
1. Spotting Traders Under Stress

One of the most powerful opportunities occurs when many traders are forced to exit positions.

This usually happens during:

  • panic selling
  • stop loss cascades
  • sudden news events

These moments often create sharp price movements.

2. Mental Discipline

Trading success is not only about strategy.

It is also about emotional control.

You must stay:

  • calm
  • focused
  • confident

Otherwise fear and greed will control your decisions.

3. Strong Risk Management

Even the best traders are wrong sometimes.

So every trade must be planned carefully.

The real goal is simple:

Keep losses small and allow profits to grow.

4. Experience Matters

No book or course can replace real trading experience.

The more time you spend observing charts and executing trades, the better you become at:

  • reading trends
  • managing risk
  • controlling emotions

The Real Key to Consistent Profit

If there is one lesson I wish someone told me earlier, it would be this:

Follow the trend.

When the market is bullish, look for buying opportunities.

When the market is bearish, look for short selling opportunities.

Trying to fight the trend usually leads to losses.

Final Thoughts

Markets will always contain uncertainty.

Prices will move up, down, and sideways depending on the interaction between buyers and sellers.

But if you focus on:

  • understanding price movement
  • maintaining discipline
  • managing risk
  • gaining experience

you gradually develop the trading edge needed for consistent profit.

And once you truly understand how markets work, you will realize something powerful:

Profit opportunities exist in stocks, gold, crypto, and forex — regardless of whether prices are rising or falling.

Written By-
Arvind Singh (The Beast Trader)

Tags: beginner trading guidebuyers vs sellers in tradingcrypto trading for beginnersforex trading basics explainedgold trading strategy for beginnershow price moves in stock markethow short selling works in stock markethow to make money when market fallshow to make profit in stock markethow to trade gold crypto forexintraday trading strategy for beginnersintraday vs delivery trading differencelong vs short position tradingmarket psychology tradingprice action trading conceptsrisk management in tradingshort selling explainedstock market trend analysistrading discipline psychologytrading edge in stock market

Leave a Reply Cancel reply

Your email address will not be published. Required fields are marked *

  • Trending
  • Comments
  • Latest
Infographic explaining the Wyckoff Market Cycle showing accumulation, markup, distribution and markdown phases in price action trading

The Wyckoff Cycle Explained: How Smart Money Moves the Market

March 16, 2026
U.S. military strikes near Kharg Island Iran oil export terminal in the Persian Gulf highlighting Strait of Hormuz shipping route and global oil market tensions

Kharg Island Iran News: U.S. Strikes Near Iran’s Key Oil Hub Raise Strait of Hormuz Tensions

March 15, 2026
Infographic explaining what price action trading is and how traders analyze price movement using charts, candlesticks, support and resistance

What Is Price, Why Prices Move, and What Is Price Action Trading

March 15, 2026
Infographic explaining how to make profit in the financial market using trading strategies, price action and risk management for beginners

How I Make Profit in the Market: Stock, Gold, Crypto & Forex Trading Explained for Beginners

March 16, 2026
Infographic explaining the Wyckoff Market Cycle showing accumulation, markup, distribution and markdown phases in price action trading

The Wyckoff Cycle Explained: How Smart Money Moves the Market

1
SEBI Mutual Fund New Rules 2026 explaining portfolio overlap cap, lifecycle funds, sectoral debt funds and gold silver valuation changes

SEBI Mutual Fund New Rules 2026: Lifecycle Funds & Gold Valuation Reform Explained

0
Global markets volatility after US Supreme Court tariff ruling and Trump 15% tariff proposal impacting forex, gold, crypto and commodities

Tariff Shockwaves: Supreme Court Ruling, Trump’s 15% Plan & What It Means for Forex, Gold and Crypto

0
Kuwait oil production cuts amid Strait of Hormuz tensions impacting global oil supply, crude oil markets, gold, forex and commodity markets

Kuwait Cuts Oil Production Amid Strait of Hormuz Tensions: What It Means for Global Oil, Gold, Forex, and Crypto Markets

0
Infographic showing stock market growth data and retail rally statistics including returns, inflows and market size figures

Markets Soar on Shaky Iran–US Ceasefire: Sensex Jumps Nearly 4% in Biggest Rally in 5 Years

April 9, 2026
Infographic showing gold price today with latest update in India including 24K and 22K gold rates and market trend

Gold Price Today (March 19, 2026): Gold & Silver See Sharp Decline – Check Latest 24K, 22K, 18K Rates City-Wise

March 19, 2026
Infographic showing stock market open or closed status during holidays with trading schedule and NSE BSE timings

📊 Will Stock Market Open on Gudi Padwa, Eid & Navratri 2026? (Full NSE & BSE Holiday List Explained)

March 19, 2026
Infographic explaining market structure in trading showing impulse moves and pullbacks in price action trend

Market Structure Basics: Impulse, Pullback, Momentum & Climax (A Trader’s Real Learning Experience)

March 16, 2026
The Beast Trader

© 2026 The Beast Trader - All Rights Reserved. Educational Price Action & Professional Trading Strategies Platform. The Beast Trader.

Navigate Site

  • Home
  • Privacy Policy
  • Contact Us
  • About Us

Follow Us

Welcome Back!

Login to your account below

Forgotten Password? Sign Up

Create New Account!

Fill the forms below to register

All fields are required. Log In

Retrieve your password

Please enter your username or email address to reset your password.

Log In
No Result
View All Result
  • Home
  • Price Action
    • Foundations
      • Basics Of Market
    • Core Price Action Structure
      • Foundations Of Price Action
      • Understandind Support & Resistance like a pro
      • Market Structure & Phases
      • Trending vs Sideways
    • Candlestick Trading Mastery
      • Complete Candlestick Trading Blueprint
      • Advance Candlestick Interpretation
    • High Probability Patterns
      • A. Major Reversal Structure
      • B. Continuation Patterns
      • C. Neutral & Compression Patterns
    • Indicators With Price Action
      • Moving Averages With Price Action
      • Volume Analysis In Price Action
      • RSI & Bollinger Bands Confirmation
    • Professional Trade Management
      • Professional Risk Management Framework
      • Position Sizing Mastery
      • Trailing Stop Techniques
      • Re-Entries & Partial Exits
    • Real Market Applications & Case Studies
  • Indian Stocks
  • Gold & Commodities
  • Markets
  • Technical Analysis
  • Forex
  • Contact Us
  • Calculator

© 2026 The Beast Trader - All Rights Reserved. Educational Price Action & Professional Trading Strategies Platform. The Beast Trader.