When I first started trading, I used to think that markets move randomly.
Sometimes the price would suddenly shoot up, sometimes it would drop sharply, and I would often feel confused about why the market moved the way it did.
At that time, I didn’t understand some very small but extremely powerful concepts like Impulse, Pullback, Momentum, and Climax.
Honestly, these concepts looked simple when I first heard them, but once I understood them deeply, I realized something important:
Most traders lose money not because the market is difficult, but because they don’t understand these small pieces of market structure.
In this article, I will explain these concepts in the same way I learned them through experience.
Understanding Market Structure
One of the first lessons I learned is that markets never move in a straight line.
Even in the strongest trends, price moves in a wave-like pattern.
Instead of moving like this:
Straight Up ↑
The market actually moves like this:
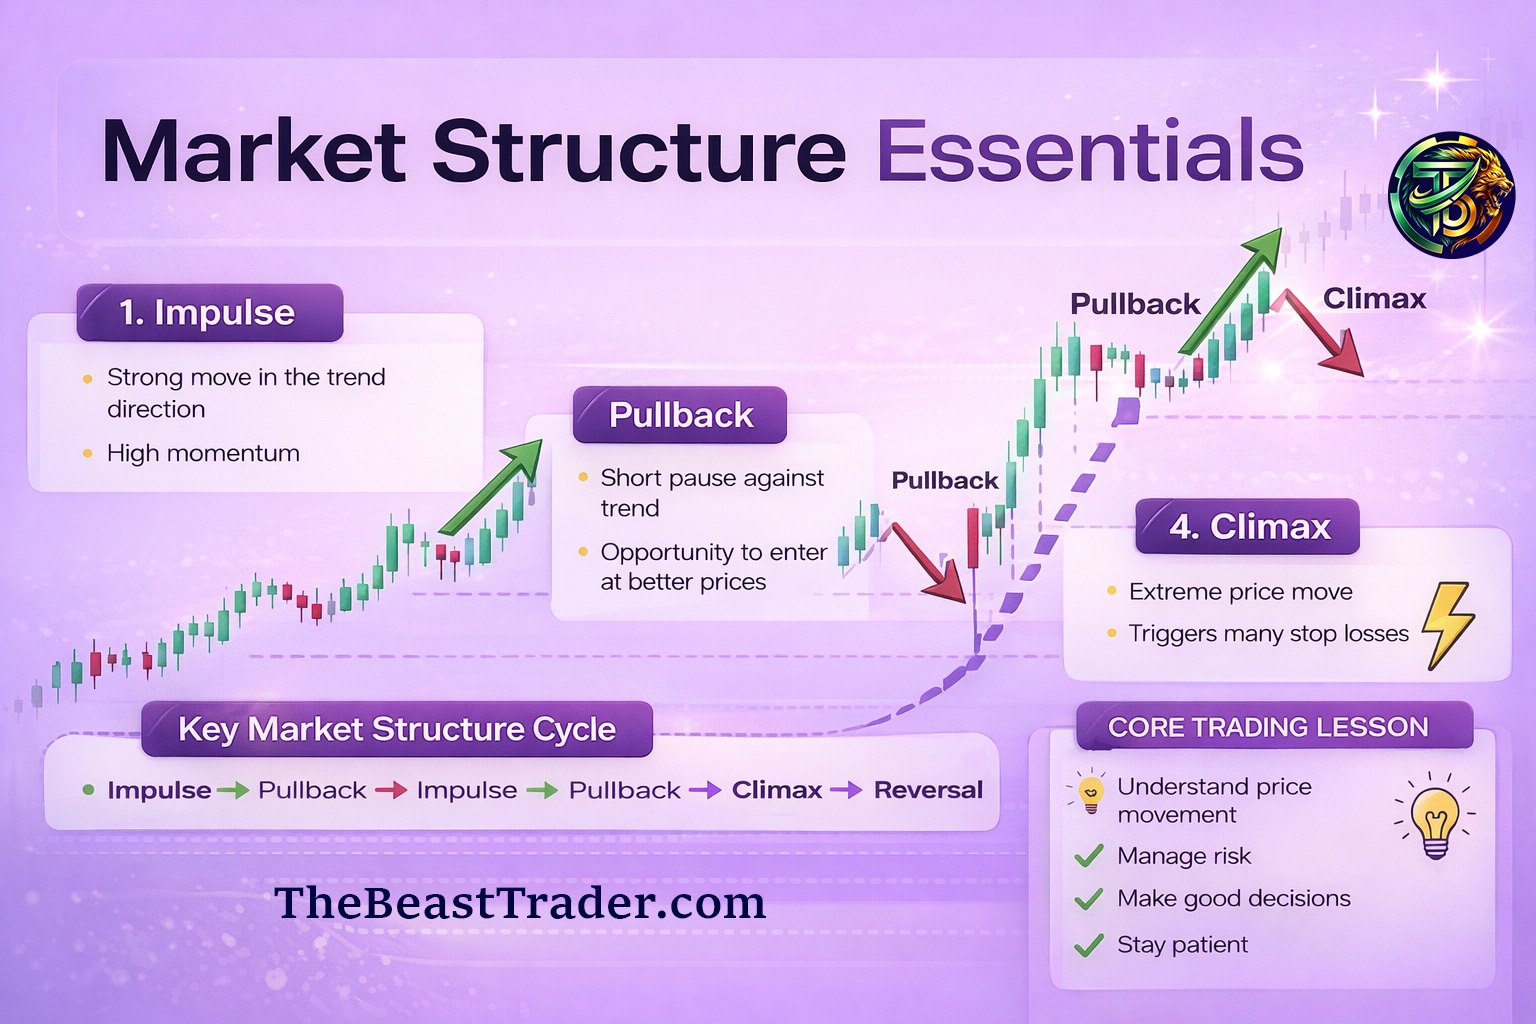
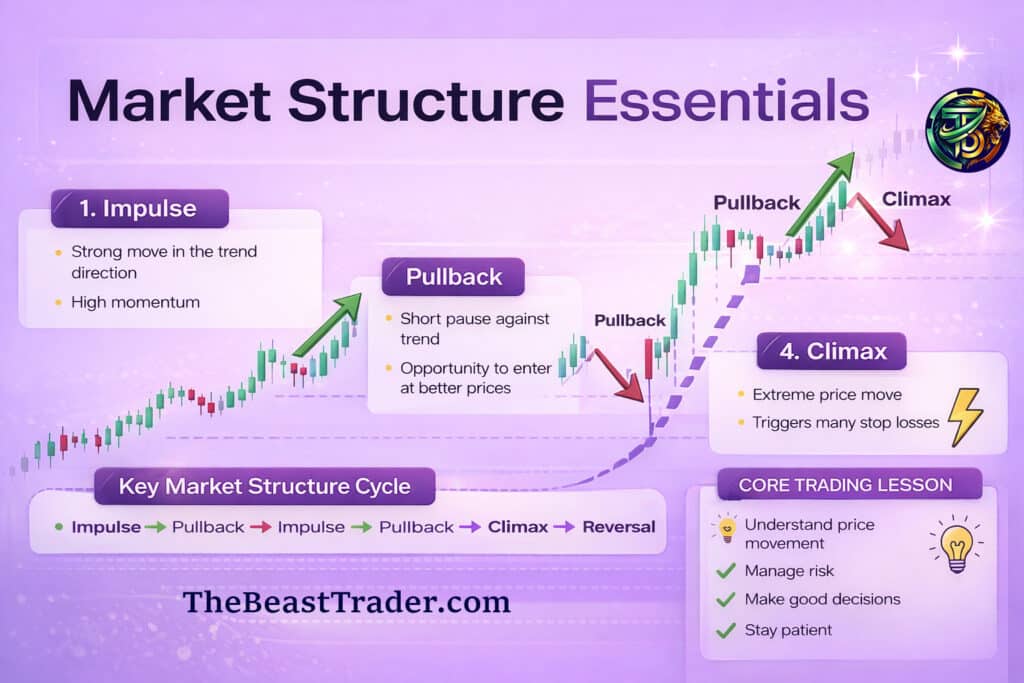
Impulse → Pullback → Impulse → Pullback
This zig-zag movement is called Market Structure.
Once I started recognizing this structure on charts, trading suddenly started making much more sense.
1. Impulse Move – When the Market Moves with Power
An Impulse is a strong and fast move in the direction of the trend.
When I first noticed impulse moves on charts, I realized that these moves usually happen when buyers or sellers take strong control of the market.
Characteristics of an impulse move:
• Large candlesticks
• Strong directional movement
• High momentum
• Little or no retracement
For example, in an uptrend you might suddenly see the price moving up very quickly. That is an impulse move.
This is usually where big traders and institutions push the market in one direction.
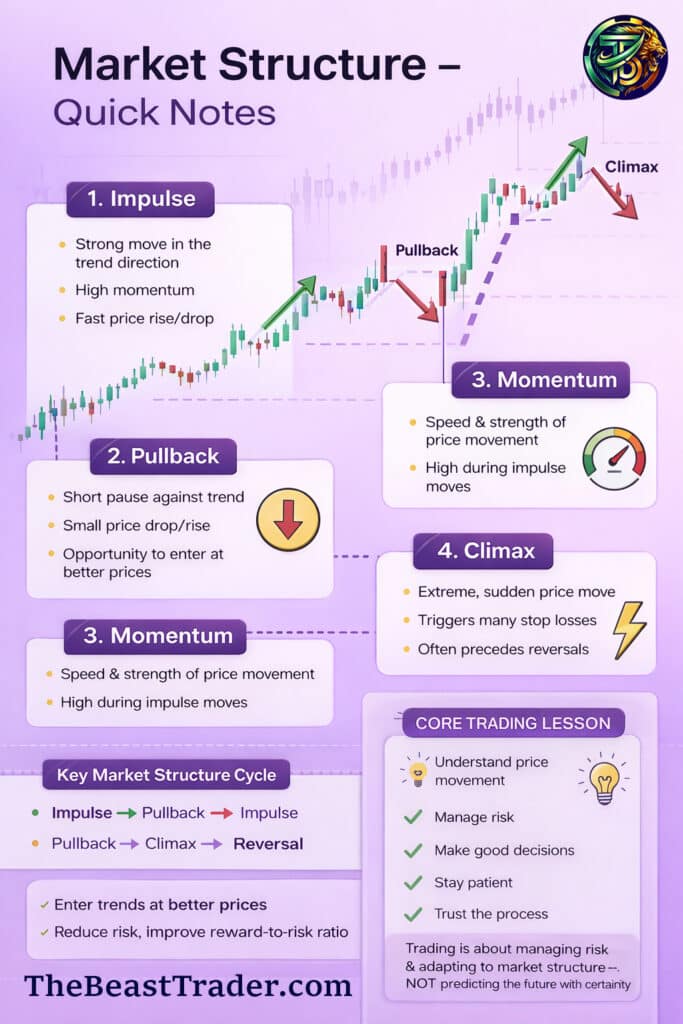
2. Pullback – The Market Taking a Breath
At the beginning of my trading journey, I used to think that when price started dropping slightly during an uptrend, the trend was ending.
But that was a mistake.
What I later understood was that the market often takes a small pause before continuing the trend. This pause is called a Pullback.
A pullback is simply:
A temporary move against the main trend.
Characteristics of pullbacks:
• Short-term correction
• Smaller candles compared to impulse
• Price temporarily moves opposite to trend
• Opportunity to enter trades at better prices
This realization completely changed the way I trade.
Instead of chasing the market during strong moves, I started waiting for pullbacks to enter trades more safely.
3. Momentum – The Speed of the Market
Another concept that helped me understand price action better is Momentum.
Momentum simply refers to how fast and how strongly the price is moving.
High momentum usually appears when:
• An impulse move is happening
• Large candles appear
• Buyers or sellers dominate
Low momentum appears when:
• The market slows down
• Candles become smaller
• Consolidation begins
Understanding momentum helped me identify when the market is strong and when it is losing strength.
4. Climax – Extreme Market Movement
One of the most interesting things I learned while studying charts was the concept of a Climax.
A climax is an extreme and sudden price movement, often caused by panic, stop-loss triggering, or large institutional activity.
For example:
Imagine the market is trending upward and suddenly there is a sharp drop in price within minutes.
This type of move is called a Climax Move.
Common characteristics of a climax:
• Very rapid price movement
• Huge trading volume
• Many stop losses get triggered
• Emotional market reaction
What surprised me the most was discovering that climax moves often happen just before a market reversal.
Large players sometimes push the market sharply to trigger stop losses and collect liquidity before reversing direction.
Why Pullbacks Are So Valuable for Traders
One of the biggest mistakes new traders make is entering trades during impulse moves.
But through experience, I realized that the smarter entry is usually during a pullback.
Pullbacks allow traders to:
• Enter the trend at better prices
• Reduce risk
• Improve reward-to-risk ratio
• Avoid emotional trading
This simple shift in thinking improved my trading decisions significantly.
The Typical Market Structure Cycle
After observing thousands of charts, I noticed that many trends follow a similar pattern.
Impulse → Pullback → Impulse → Pullback → Climax → Reversal
Once you train your eyes to see this structure, you start understanding what the market might do next.
Not with certainty, but with much better probability.
The Real Lesson I Learned About Trading
One of the biggest realizations in my trading journey was this:
Trading is not about predicting the future perfectly.
It is about:
• Understanding how price moves
• Managing risk properly
• Making disciplined decisions
• Staying patient during uncertainty
Once I started focusing on these fundamentals instead of chasing quick profits, my entire perspective on trading changed.
Final Thoughts
If you are serious about learning trading, start paying attention to these small concepts.
Impulse, Pullback, Momentum, and Climax might seem basic, but they form the foundation of price action trading.
Mastering them can dramatically improve the way you read charts and understand market behavior.
Remember:
The market always leaves clues in its structure.
You just need to train your eyes to see them.
Written & Explained By
Arvind Singh
“The Beast Trader”


