The Beast Trader logo – price action trading education and professional trading strategies platform
No Result
View All Result
Tuesday, April 14, 2026
  • Login
  • Register
  • Home
  • Price Action
    • Foundations
      • Basics Of Market
    • Core Price Action Structure
      • Foundations Of Price Action
      • Understandind Support & Resistance like a pro
      • Market Structure & Phases
      • Trending vs Sideways
    • Candlestick Trading Mastery
      • Complete Candlestick Trading Blueprint
      • Advance Candlestick Interpretation
    • High Probability Patterns
      • A. Major Reversal Structure
      • B. Continuation Patterns
      • C. Neutral & Compression Patterns
    • Indicators With Price Action
      • Moving Averages With Price Action
      • Volume Analysis In Price Action
      • RSI & Bollinger Bands Confirmation
    • Professional Trade Management
      • Professional Risk Management Framework
      • Position Sizing Mastery
      • Trailing Stop Techniques
      • Re-Entries & Partial Exits
    • Real Market Applications & Case Studies
  • Indian Stocks
  • Gold & Commodities
  • Markets
  • Forex
  • Calculator
The Beast Trader logo – price action trading education and professional trading strategies platform
  • Home
  • Price Action
    • Foundations
      • Basics Of Market
    • Core Price Action Structure
      • Foundations Of Price Action
      • Understandind Support & Resistance like a pro
      • Market Structure & Phases
      • Trending vs Sideways
    • Candlestick Trading Mastery
      • Complete Candlestick Trading Blueprint
      • Advance Candlestick Interpretation
    • High Probability Patterns
      • A. Major Reversal Structure
      • B. Continuation Patterns
      • C. Neutral & Compression Patterns
    • Indicators With Price Action
      • Moving Averages With Price Action
      • Volume Analysis In Price Action
      • RSI & Bollinger Bands Confirmation
    • Professional Trade Management
      • Professional Risk Management Framework
      • Position Sizing Mastery
      • Trailing Stop Techniques
      • Re-Entries & Partial Exits
    • Real Market Applications & Case Studies
  • Indian Stocks
  • Gold & Commodities
  • Markets
  • Forex
  • Calculator
No Result
View All Result
The Beast Trader logo – price action trading education and professional trading strategies platform
No Result
View All Result
Home Gold & Commodities

Gold Price Today (March 19, 2026): Gold & Silver See Sharp Decline – Check Latest 24K, 22K, 18K Rates City-Wise

by Arvind Singh
March 19, 2026
in Gold & Commodities, Indian Stocks, Markets
0
Infographic showing gold price today with latest update in India including 24K and 22K gold rates and market trend

Check today’s gold price in India with latest updates for 22K and 24K gold rates along with market trends.

153
SHARES
1.9k
VIEWS
Share on FacebookShare on TwitterShare on WhatsApp

📊 Market Overview

On March 19, 2026, the gold and silver markets witnessed a significant decline, reflecting weak global cues and macroeconomic pressure. Both domestic and international bullion prices fell sharply due to a combination of a stronger US dollar, rising bond yields, and the Federal Reserve’s continued hawkish stance.

  • MCX Gold dropped to approximately ₹1,47,200 per 10 grams
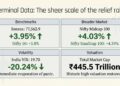
  • Gold Futures declined by ₹3,616 (≈ 2.36%)
  • Silver Prices plunged up to 9% in global markets
  • International Gold slipped below $4,700 per ounce

This sharp correction indicates a short-term bearish sentiment in the bullion market.

🏙️ City-Wise Gold Rate Today (Per Gram)

Below are the latest gold rates across major Indian cities:

City24K (₹/gm)22K (₹/gm)18K (₹/gm)
Chennai15,60014,30011,980
Mumbai15,46414,17511,598
Delhi15,47914,19011,613
Kolkata15,46414,17511,598
Bangalore15,46414,17511,598
Hyderabad15,46414,17511,598
Kerala15,46414,17511,598
Pune15,46414,17511,598
Vadodara15,46914,18011,603
Ahmedabad15,46914,18011,603
Infographic showing gold price today with latest update in India including 24K and 22K gold rates and market trend
Check today’s gold price in India with latest updates for 22K and 24K gold rates along with market trends.

📉 Daily Price Change

  • 24K Gold ↓ ₹311
  • 22K Gold ↓ ₹285
  • 18K Gold ↓ ₹233

📍 City-Wise Breakdown

  • Delhi / Jaipur / Kanpur
    24K: ₹15,479 | 22K: ₹14,190 | 18K: ₹11,613
  • Mumbai / Pune / Kolkata / Hyderabad / Bengaluru
    24K: ₹15,464 | 22K: ₹14,175 | 18K: ₹11,598
  • Ahmedabad / Vadodara
    24K: ₹15,469 | 22K: ₹14,180 | 18K: ₹11,603

Prices remain largely uniform across cities due to dominant global market influences.

📉 Key Reasons Behind the Fall in Gold Prices

1. Strengthening US Dollar

A stronger US dollar reduces the attractiveness of gold, as bullion is globally traded in USD.

2. Rising Bond Yields

Increasing US Treasury yields are encouraging investors to shift from gold to interest-bearing assets.

3. Federal Reserve Policy

The Federal Reserve maintained interest rates at 3.5%–3.75% and indicated a prolonged high-rate environment, limiting gold’s upside potential.

4. Surge in Crude Oil Prices

Geopolitical tensions, particularly involving Iran, have pushed crude oil prices above $100, increasing inflation concerns.

5. Geopolitical Tensions

Although geopolitical instability typically supports gold, the current strength of the US dollar has offset safe-haven demand.

📊 MCX & Global Market Snapshot

Market TypePrice Level
MCX Gold₹1,47,200 / 10g
MCX Silver₹2.31 lakh / kg
COMEX Gold~$4,684 / oz
COMEX Silver~$70–72 / oz

🔍 Expert Outlook

  • Resistance Level: ₹1,50,000
  • Support Zone: ₹1,44,000 – ₹1,42,000
  • Trend: Weak and volatile in the short term

Analysts suggest that unless the US dollar weakens or interest rate expectations shift, gold may struggle to gain upward momentum.

💡 Investment Perspective

  • Short-Term Traders:
    Market conditions remain volatile and bearish.
  • Long-Term Investors:
    Price corrections may present attractive buying opportunities.
  • Silver Outlook:
    Silver is emerging as a more affordable alternative, especially during festive demand cycles.

🪔 Impact of Festive Demand

Despite high prices, demand remains resilient due to cultural significance. Trends indicate:

  • Increased demand for lightweight jewellery
  • Growing adoption of digital gold
  • Rising preference for silver as a gifting option

This may help limit further downside in prices.

📌 Conclusion

Gold and silver prices have experienced a sharp correction driven by macroeconomic pressures such as a strong US dollar, rising bond yields, and the Federal Reserve’s policy stance.

  • Short-Term Outlook: Bearish with high volatility
  • Long-Term Outlook: Positive, with buying opportunities on dips

Investors should remain cautious in the near term while considering strategic accumulation for long-term gains.


Written By
Arvind Singh (The Beast Trader)

Tags: bullion market indiacomex gold pricegold investment india 2026gold market news todaygold price forecastgold price march 19 2026gold price prediction indiagold price today indiagold rate city wise indiagold rate today 24k 22k 18kgold trading analysisgold vs dollar relationshipmcx gold price todaysilver price today indiawhy gold price falling

Leave a Reply Cancel reply

Your email address will not be published. Required fields are marked *

  • Trending
  • Comments
  • Latest
Infographic explaining the Wyckoff Market Cycle showing accumulation, markup, distribution and markdown phases in price action trading

The Wyckoff Cycle Explained: How Smart Money Moves the Market

March 16, 2026
U.S. military strikes near Kharg Island Iran oil export terminal in the Persian Gulf highlighting Strait of Hormuz shipping route and global oil market tensions

Kharg Island Iran News: U.S. Strikes Near Iran’s Key Oil Hub Raise Strait of Hormuz Tensions

March 15, 2026
Infographic explaining what price action trading is and how traders analyze price movement using charts, candlesticks, support and resistance

What Is Price, Why Prices Move, and What Is Price Action Trading

March 15, 2026
Infographic explaining how to make profit in the financial market using trading strategies, price action and risk management for beginners

How I Make Profit in the Market: Stock, Gold, Crypto & Forex Trading Explained for Beginners

March 16, 2026
Infographic explaining the Wyckoff Market Cycle showing accumulation, markup, distribution and markdown phases in price action trading

The Wyckoff Cycle Explained: How Smart Money Moves the Market

1
SEBI Mutual Fund New Rules 2026 explaining portfolio overlap cap, lifecycle funds, sectoral debt funds and gold silver valuation changes

SEBI Mutual Fund New Rules 2026: Lifecycle Funds & Gold Valuation Reform Explained

0
Global markets volatility after US Supreme Court tariff ruling and Trump 15% tariff proposal impacting forex, gold, crypto and commodities

Tariff Shockwaves: Supreme Court Ruling, Trump’s 15% Plan & What It Means for Forex, Gold and Crypto

0
Kuwait oil production cuts amid Strait of Hormuz tensions impacting global oil supply, crude oil markets, gold, forex and commodity markets

Kuwait Cuts Oil Production Amid Strait of Hormuz Tensions: What It Means for Global Oil, Gold, Forex, and Crypto Markets

0
Infographic showing stock market growth data and retail rally statistics including returns, inflows and market size figures

Markets Soar on Shaky Iran–US Ceasefire: Sensex Jumps Nearly 4% in Biggest Rally in 5 Years

April 9, 2026
Infographic showing gold price today with latest update in India including 24K and 22K gold rates and market trend

Gold Price Today (March 19, 2026): Gold & Silver See Sharp Decline – Check Latest 24K, 22K, 18K Rates City-Wise

March 19, 2026
Infographic showing stock market open or closed status during holidays with trading schedule and NSE BSE timings

📊 Will Stock Market Open on Gudi Padwa, Eid & Navratri 2026? (Full NSE & BSE Holiday List Explained)

March 19, 2026
Infographic explaining market structure in trading showing impulse moves and pullbacks in price action trend

Market Structure Basics: Impulse, Pullback, Momentum & Climax (A Trader’s Real Learning Experience)

March 16, 2026
The Beast Trader

© 2026 The Beast Trader - All Rights Reserved. Educational Price Action & Professional Trading Strategies Platform. The Beast Trader.

Navigate Site

  • Home
  • Privacy Policy
  • Contact Us
  • About Us

Follow Us

Welcome Back!

Login to your account below

Forgotten Password? Sign Up

Create New Account!

Fill the forms below to register

All fields are required. Log In

Retrieve your password

Please enter your username or email address to reset your password.

Log In
No Result
View All Result
  • Home
  • Price Action
    • Foundations
      • Basics Of Market
    • Core Price Action Structure
      • Foundations Of Price Action
      • Understandind Support & Resistance like a pro
      • Market Structure & Phases
      • Trending vs Sideways
    • Candlestick Trading Mastery
      • Complete Candlestick Trading Blueprint
      • Advance Candlestick Interpretation
    • High Probability Patterns
      • A. Major Reversal Structure
      • B. Continuation Patterns
      • C. Neutral & Compression Patterns
    • Indicators With Price Action
      • Moving Averages With Price Action
      • Volume Analysis In Price Action
      • RSI & Bollinger Bands Confirmation
    • Professional Trade Management
      • Professional Risk Management Framework
      • Position Sizing Mastery
      • Trailing Stop Techniques
      • Re-Entries & Partial Exits
    • Real Market Applications & Case Studies
  • Indian Stocks
  • Gold & Commodities
  • Markets
  • Technical Analysis
  • Forex
  • Contact Us
  • Calculator

© 2026 The Beast Trader - All Rights Reserved. Educational Price Action & Professional Trading Strategies Platform. The Beast Trader.