When I checked the gold market this morning, one thing was immediately clear — gold prices have staged a strong comeback. After a brief correction in the past few sessions, the precious metal has surged sharply again as investors shift toward safe-haven assets amid rising geopolitical tensions and global economic uncertainty.
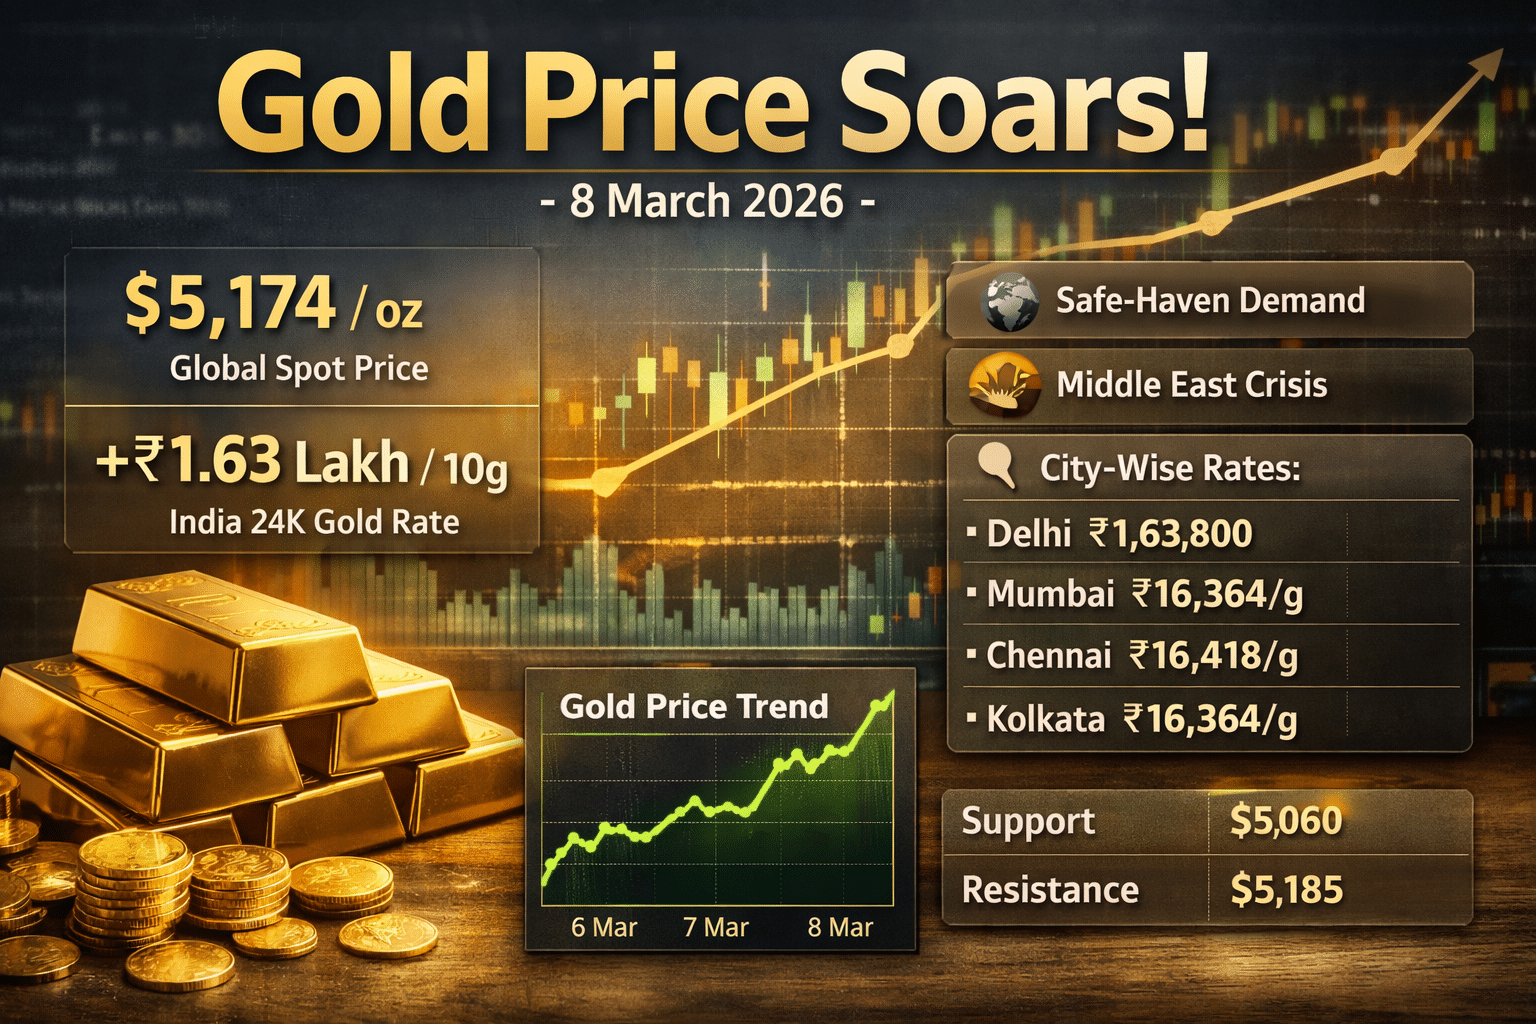
In the international market, spot gold climbed to around $5,174 per ounce, marking a strong daily gain. At the same time, in the Indian bullion market, the price of 24-carat gold in Delhi moved close to ₹1.63 lakh per 10 grams, reflecting the global rally.
The renewed interest in gold suggests that investors are once again looking for stability while global markets remain volatile.
International Gold Price Update
From my observation of global markets, gold prices have rebounded significantly as risk sentiment in financial markets weakens.
| Global Gold Indicator | Latest Value |
|---|---|
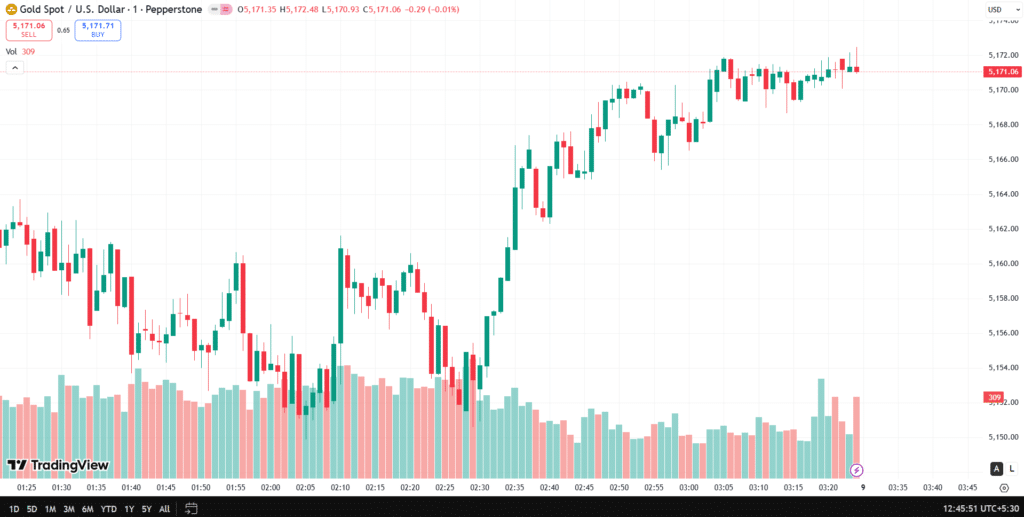
| Spot Gold Price | $5,174.23 per ounce |
| Approx. Price Per Gram | $166.36 |
| Daily Change | +1.69% (+$85.74) |
| Intraday High | $5,176.50 |
| Intraday Low | $5,060.13 |
Why Gold Prices Are Rising Globally
From the data and market trends I reviewed, three key factors appear to be driving the surge:
- Safe-Haven Buying: Investors often move toward gold during geopolitical uncertainty.
- Global Economic Concerns: Volatility in global financial markets continues to support precious metals.
- Technical Rebound: After recent declines, buyers entered the market at lower price levels, triggering a strong recovery.
Gold Futures Price Movement (GCW00)
While tracking gold futures, I noticed a steady upward trend developing over the past trading sessions.
| Time | Gold Futures Price |
|---|---|
| 6 Mar – 3:00 PM | $5,100 |
| 6 Mar – 8:00 PM | $5,120 |
| 7 Mar – 1:00 AM | $5,140 |
| 7 Mar – 6:00 AM | $5,150 |
| 7 Mar – 10:28 AM IST | $5,158.70 |
Market Statistics
- Opening Price: $5,099.70
- Day’s High: $5,185.00
- Day’s Low: $5,071.00
- Previous Close: $5,078.70
- Trading Volume: 148,507
- Open Interest: 262,874
These numbers indicate strong participation in the gold futures market as investors react to macroeconomic developments.
Gold Price in India Today (8 March 2026)
The rally in international gold markets has directly impacted domestic gold prices in India. Across major cities, gold prices increased by roughly ₹250 per gram in a single session.
| Gold Purity | Price per Gram | Price per 10 Grams | Daily Change |
|---|---|---|---|
| 24K Gold (Pure Gold) | ₹16,380 | ₹1,63,800 | +₹252 |
| 22K Gold (Jewellery Gold) | ₹15,015 | ₹1,50,150 | +₹230 |
| 18K Gold | ₹12,288 | ₹1,22,880 | +₹188 |
The sharp rise highlights how closely Indian gold prices track international market movements.
City-Wise Gold Rates in India (24K Gold)
Gold prices can vary slightly between cities due to taxes, transportation costs, and local demand.
| City | 24K Gold Price per Gram |
|---|---|
| Chennai | ₹16,418 |
| Mumbai | ₹16,364 |
| Kolkata | ₹16,364 |
| Bangalore | ₹16,364 |
| Delhi | ₹16,380 |
| Gurgaon | ₹16,380 |
| Noida | ₹16,380 |
Gold Price Trend in Delhi (Last 10 Days)
Looking at the recent trend in Delhi, gold prices have seen both corrections and quick rebounds.
| Date | 24K Gold | 22K Gold |
|---|---|---|
| 08 Mar 2026 | ₹16,380 | ₹15,015 |
| 07 Mar 2026 | ₹16,128 | ₹14,785 |
| 06 Mar 2026 | ₹16,303 | ₹14,945 |
| 05 Mar 2026 | ₹16,466 | ₹15,095 |
| 04 Mar 2026 | ₹16,777 | ₹15,380 |
| 03 Mar 2026 | ₹17,066 | ₹15,645 |
| 02 Mar 2026 | ₹17,323 | ₹15,880 |
| 01 Mar 2026 | ₹16,886 | ₹15,480 |
| 28 Feb 2026 | ₹16,172 | ₹14,825 |
| 27 Feb 2026 | ₹16,183 | ₹14,835 |
Average Gold Price Comparison in Delhi
| Time Period | 24K Average Price | 22K Average Price |
|---|---|---|
| Last 10 Days | ₹16,611 | ₹15,227 |
| 1 Month | ₹16,072 | ₹14,734 |
| 6 Months | ₹13,620 | ₹12,486 |
| 1 Year | ₹11,685 | ₹10,712 |
The long-term data shows how gold has steadily gained value over the past year.
Best Platforms to Buy Gold in India (2026)
From what I have observed, investors today have several options for buying gold digitally or physically.
Digital Gold Apps
- Google Pay
- PhonePe
- Paytm (MMTC-PAMP partnership)
- Jar (micro-saving platform)
- OroPocket
Jewellery Brand Platforms
- Tanishq DigiGold
- CaratLane
- Candere (Kalyan Jewellers)
Investment Platforms
These platforms allow investors to buy gold with small investments, systematic plans, or physical delivery options.
What the Latest Gold Rally Means for Investors
From my perspective, the sharp rebound in gold prices reinforces one important point — gold continues to serve as a reliable safe-haven asset during uncertain times.
Key Levels I Am Watching
International Gold Market
- Support Level: $5,060 per ounce
- Resistance Level: $5,185 per ounce
Indian Gold Market (Delhi – 24K)
- Support: ₹1,61,000 per 10g
- Resistance: ₹1,68,000 per 10g
For long-term investors, gold still plays an important role in portfolio diversification and risk management.
Many investors prefer systematic investments through Gold ETFs or digital gold SIPs, as this approach helps reduce market timing risk while steadily building exposure to the precious metal.
By – Arvind Singh (The Beast Trader)


