The Beast Trader logo – price action trading education and professional trading strategies platform
No Result
View All Result
Tuesday, April 14, 2026
  • Login
  • Register
  • Home
  • Price Action
    • Foundations
      • Basics Of Market
    • Core Price Action Structure
      • Foundations Of Price Action
      • Understandind Support & Resistance like a pro
      • Market Structure & Phases
      • Trending vs Sideways
    • Candlestick Trading Mastery
      • Complete Candlestick Trading Blueprint
      • Advance Candlestick Interpretation
    • High Probability Patterns
      • A. Major Reversal Structure
      • B. Continuation Patterns
      • C. Neutral & Compression Patterns
    • Indicators With Price Action
      • Moving Averages With Price Action
      • Volume Analysis In Price Action
      • RSI & Bollinger Bands Confirmation
    • Professional Trade Management
      • Professional Risk Management Framework
      • Position Sizing Mastery
      • Trailing Stop Techniques
      • Re-Entries & Partial Exits
    • Real Market Applications & Case Studies
  • Indian Stocks
  • Gold & Commodities
  • Markets
  • Forex
  • Calculator
The Beast Trader logo – price action trading education and professional trading strategies platform
  • Home
  • Price Action
    • Foundations
      • Basics Of Market
    • Core Price Action Structure
      • Foundations Of Price Action
      • Understandind Support & Resistance like a pro
      • Market Structure & Phases
      • Trending vs Sideways
    • Candlestick Trading Mastery
      • Complete Candlestick Trading Blueprint
      • Advance Candlestick Interpretation
    • High Probability Patterns
      • A. Major Reversal Structure
      • B. Continuation Patterns
      • C. Neutral & Compression Patterns
    • Indicators With Price Action
      • Moving Averages With Price Action
      • Volume Analysis In Price Action
      • RSI & Bollinger Bands Confirmation
    • Professional Trade Management
      • Professional Risk Management Framework
      • Position Sizing Mastery
      • Trailing Stop Techniques
      • Re-Entries & Partial Exits
    • Real Market Applications & Case Studies
  • Indian Stocks
  • Gold & Commodities
  • Markets
  • Forex
  • Calculator
No Result
View All Result
The Beast Trader logo – price action trading education and professional trading strategies platform
No Result
View All Result
Home Markets

Markets Soar on Shaky Iran–US Ceasefire: Sensex Jumps Nearly 4% in Biggest Rally in 5 Years

by RaghuVeer Singh
April 9, 2026
in Markets, Gold & Commodities
0
Infographic showing stock market growth data and retail rally statistics including returns, inflows and market size figures

Recent market data highlights strong retail participation, positive returns, and increasing investment inflows in the stock market.

152
SHARES
1.9k
VIEWS
Share on FacebookShare on TwitterShare on WhatsApp

📈 Markets Rally Amid Temporary Relief in Global Tensions

Indian equity markets witnessed a massive relief rally, with the Sensex jumping nearly 4%, marking its strongest session in over five years. This surge came after news of a two-week ceasefire between the United States and Iran, which temporarily eased fears of disruption in global oil supplies.

Despite the optimism, the broader geopolitical situation remains fragile, as tensions continue in the Middle East, particularly involving Israel and Lebanon.

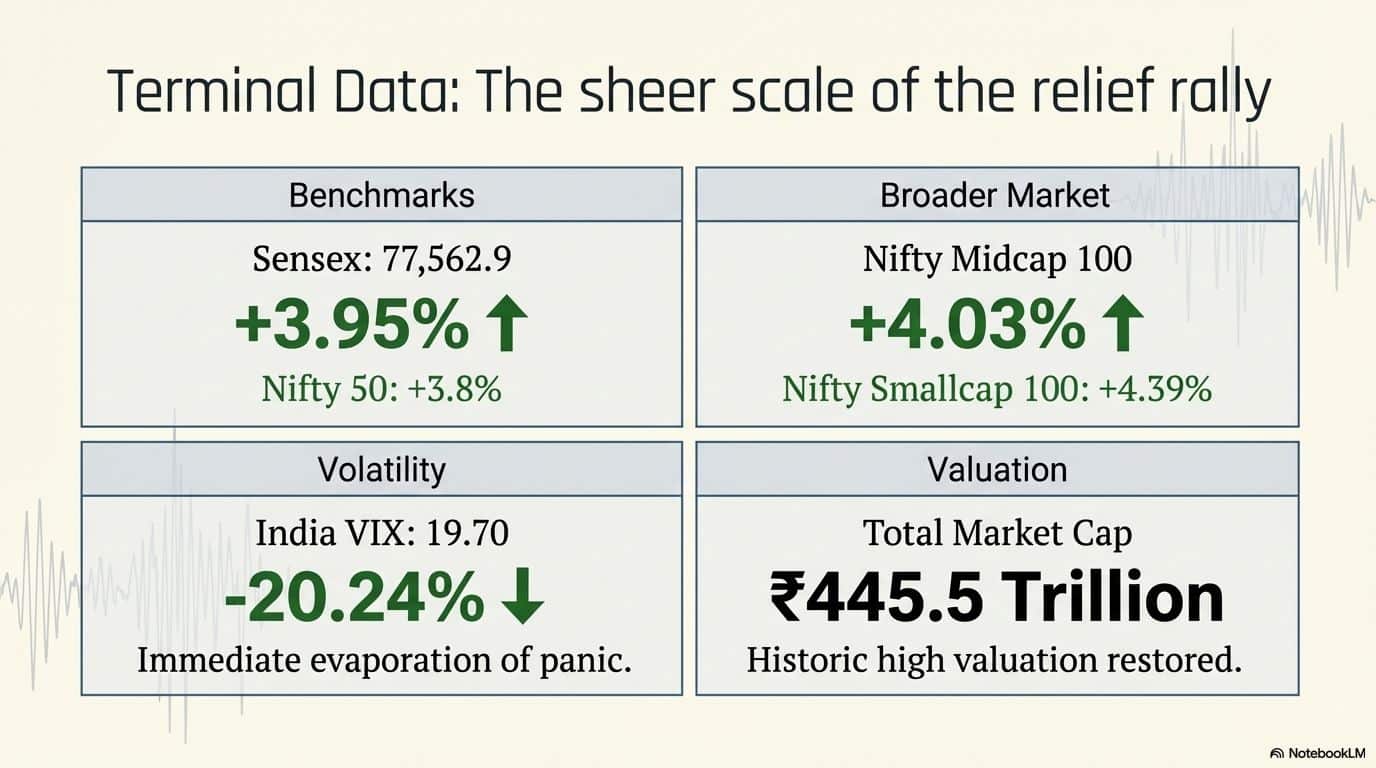
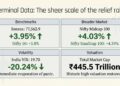
📊 Market Snapshot (Key Data)

  • Sensex: 77,562.9 (+3.95%)
  • Nifty 50: +3.8%
  • Nifty Midcap 100: +4.03%
  • Nifty Smallcap 100: +4.39%
  • India VIX (Volatility): 19.70 (↓ 20.24%)
  • Market Cap: ₹445.5 trillion
  • Rupee vs Dollar: ₹92.58 (+0.44%)
  • Brent Crude: $89.50/barrel (↓ ~1%)
  • India 10-Year Bond Yield: 6.90% (↓ 15 bps)

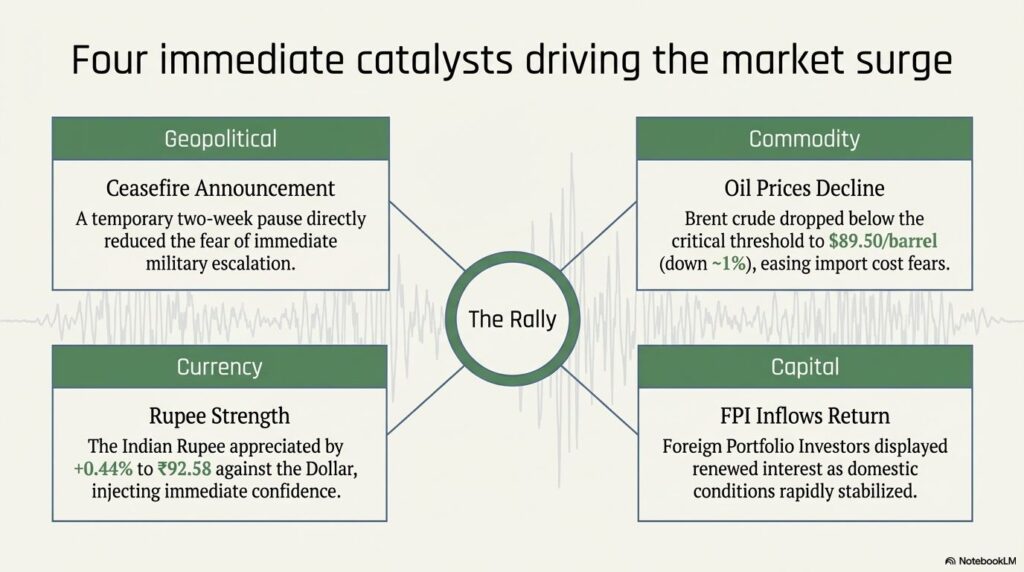
⚡ What Triggered the Market Rally?

The rally was primarily driven by:

✅ 1. Iran–US Ceasefire Announcement

  • A temporary ceasefire reduced fears of escalation.
  • Investors reacted positively to reduced geopolitical risk.

✅ 2. Oil Prices Decline

  • Brent crude dropped below $90/barrel.
  • Lower oil prices ease inflation pressure on India (a major oil importer).

✅ 3. Rupee Strength

  • The Indian rupee appreciated, boosting investor confidence.

✅ 4. FPI Inflows Return

  • Foreign investors showed renewed interest amid stabilizing conditions.

⚠️ The War Shock: What Happened Earlier?

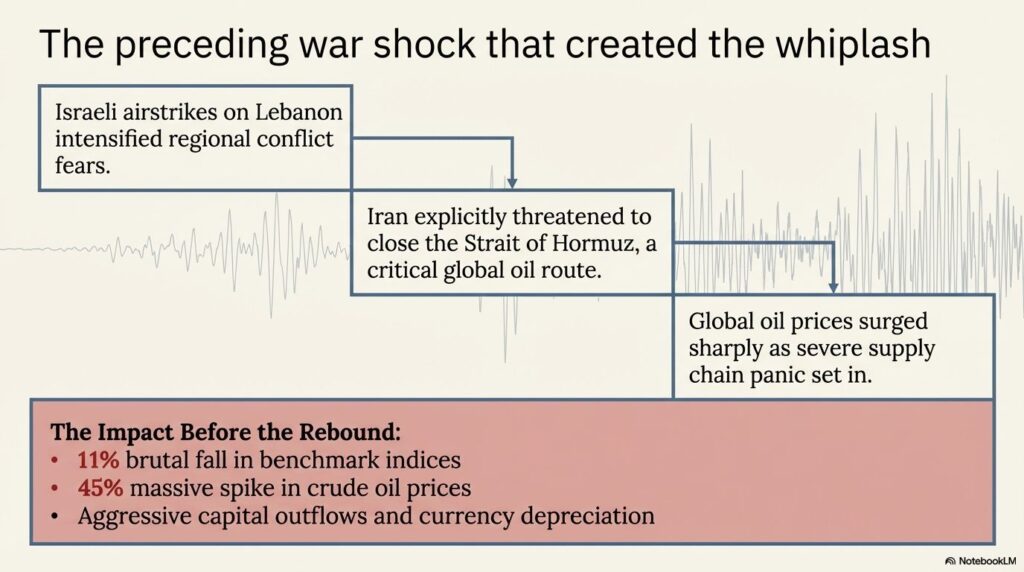
Before this rally, markets were under pressure due to escalating tensions:

  • Israeli airstrikes on Lebanon intensified conflict fears.
  • Iran threatened to close the Strait of Hormuz, a critical oil supply route.
  • Global oil prices surged sharply.
  • Indian markets saw:
    • Up to 11% fall in benchmark indices
    • Nearly 45% spike in crude prices
    • Rupee depreciation and capital outflows

Although markets bounced back, risks are still present.

🛢️ Oil vs Equities: A Key Relationship

  • Rising oil prices → Negative for Indian markets
  • Falling oil prices → Positive sentiment boost

Recent data shows:

  • Crude oil prices dropped nearly 1%
  • Nifty gained significantly during the same period

👉 This inverse relationship continues to drive short-term market moves.

💰 FPI Activity: Volatility Still Visible

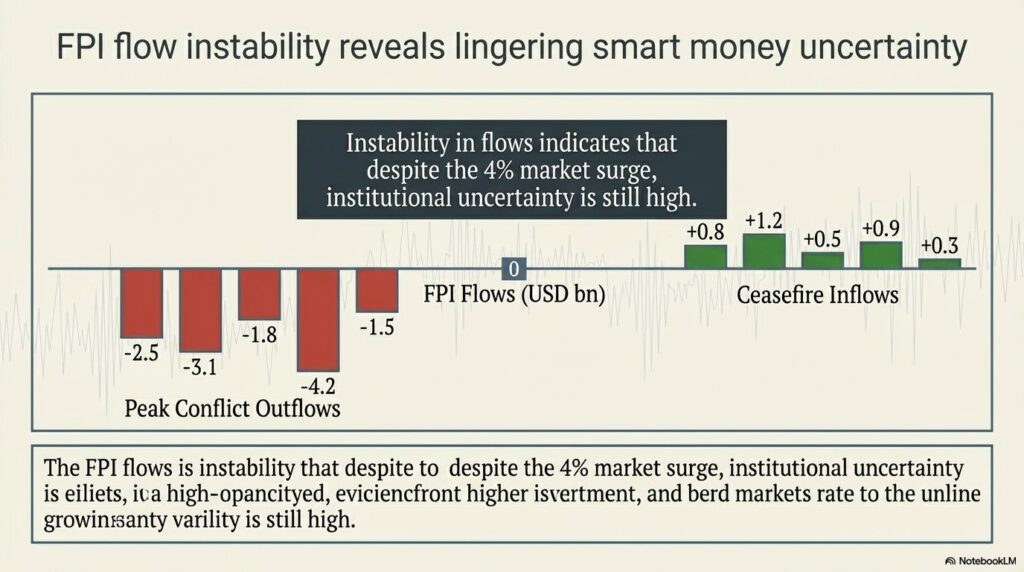
  • Net equity investments fluctuated sharply
  • Initial heavy outflows during conflict
  • Gradual return of inflows after ceasefire

👉 However, instability in flows indicates uncertainty is still high.

📉 Other Market Signals

📊 Bonds Weakening

  • 10-year yield dropped to 6.90%
  • Indicates shifting investor preference toward equities

📉 Currency Movement

  • Rupee showed recovery after earlier decline
  • Currency stability is a positive macro signal

🌍 Global Situation Still Fragile

Even with the ceasefire:

  • Strait of Hormuz remains largely blocked
  • Israeli military operations continue in Lebanon
  • US and Iran have agreed to talks in Islamabad
  • No guarantee of long-term peace

👉 This makes the current rally “relief-driven, not trend-confirmed”

🧠 Expert View: Is This Rally Sustainable?

Market experts suggest:

  • Volatility is expected to continue
  • Oil prices remain a key risk factor
  • Earnings growth may moderate to 10–12%
  • Long-term growth outlook remains intact

📊 Sector-Wise Performance

🔼 Top Gainers:

  • Banking stocks
  • Auto sector
  • Realty

🔽 Lagging Sector:

  • IT stocks (due to global uncertainty)

🚨 Key Risks Ahead

  • Breakdown of ceasefire
  • Oil supply disruptions
  • Escalation in Middle East conflict
  • Global recession fears

🧾 Conclusion: Relief Rally, Not Full Recovery

The recent surge in Indian markets is largely a sentiment-driven rebound, fueled by temporary geopolitical relief.

👉 While fundamentals remain supportive, investors should stay cautious as risks are far from over.

🔥 Pro Trading Insight (Mentor Tip)

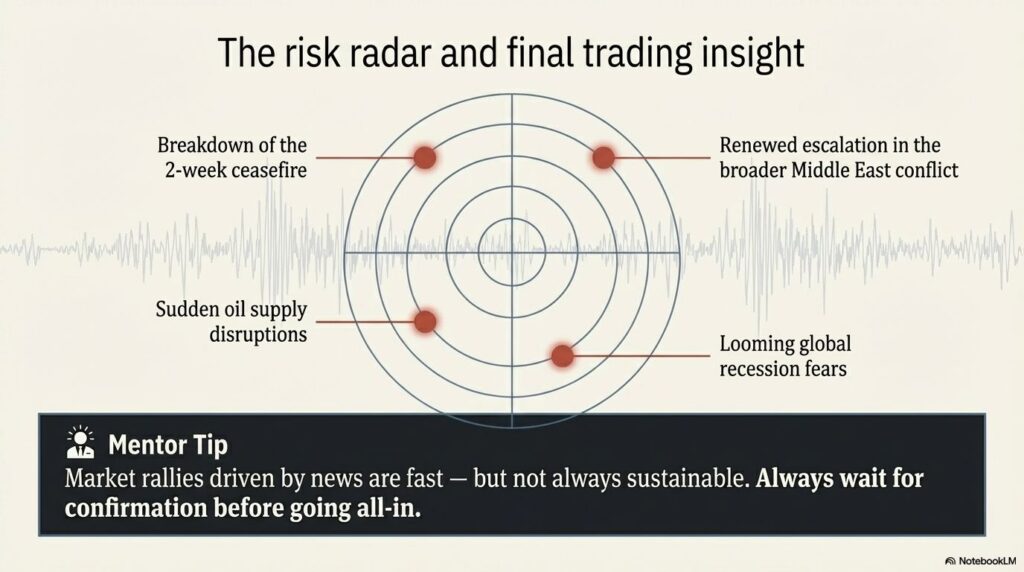
“Market rallies driven by news are fast — but not always sustainable. Always wait for confirmation before going all-in.”

Tags: crude oil price and stock market relationshipFPI inflows Indian market newsglobal geopolitical impact on stocksIndian stock market news today 2026Iran US ceasefire impact on stock marketMiddle East war stock market effectNifty surge latest updateoil prices impact on Indian economySensex rally today newswhy market is rising today India

Leave a Reply Cancel reply

Your email address will not be published. Required fields are marked *

  • Trending
  • Comments
  • Latest
Infographic explaining the Wyckoff Market Cycle showing accumulation, markup, distribution and markdown phases in price action trading

The Wyckoff Cycle Explained: How Smart Money Moves the Market

March 16, 2026
U.S. military strikes near Kharg Island Iran oil export terminal in the Persian Gulf highlighting Strait of Hormuz shipping route and global oil market tensions

Kharg Island Iran News: U.S. Strikes Near Iran’s Key Oil Hub Raise Strait of Hormuz Tensions

March 15, 2026
Infographic explaining what price action trading is and how traders analyze price movement using charts, candlesticks, support and resistance

What Is Price, Why Prices Move, and What Is Price Action Trading

March 15, 2026
Infographic explaining how to make profit in the financial market using trading strategies, price action and risk management for beginners

How I Make Profit in the Market: Stock, Gold, Crypto & Forex Trading Explained for Beginners

March 16, 2026
Infographic explaining the Wyckoff Market Cycle showing accumulation, markup, distribution and markdown phases in price action trading

The Wyckoff Cycle Explained: How Smart Money Moves the Market

1
SEBI Mutual Fund New Rules 2026 explaining portfolio overlap cap, lifecycle funds, sectoral debt funds and gold silver valuation changes

SEBI Mutual Fund New Rules 2026: Lifecycle Funds & Gold Valuation Reform Explained

0
Global markets volatility after US Supreme Court tariff ruling and Trump 15% tariff proposal impacting forex, gold, crypto and commodities

Tariff Shockwaves: Supreme Court Ruling, Trump’s 15% Plan & What It Means for Forex, Gold and Crypto

0
Kuwait oil production cuts amid Strait of Hormuz tensions impacting global oil supply, crude oil markets, gold, forex and commodity markets

Kuwait Cuts Oil Production Amid Strait of Hormuz Tensions: What It Means for Global Oil, Gold, Forex, and Crypto Markets

0
Infographic showing stock market growth data and retail rally statistics including returns, inflows and market size figures

Markets Soar on Shaky Iran–US Ceasefire: Sensex Jumps Nearly 4% in Biggest Rally in 5 Years

April 9, 2026
Infographic showing gold price today with latest update in India including 24K and 22K gold rates and market trend

Gold Price Today (March 19, 2026): Gold & Silver See Sharp Decline – Check Latest 24K, 22K, 18K Rates City-Wise

March 19, 2026
Infographic showing stock market open or closed status during holidays with trading schedule and NSE BSE timings

📊 Will Stock Market Open on Gudi Padwa, Eid & Navratri 2026? (Full NSE & BSE Holiday List Explained)

March 19, 2026
Infographic explaining market structure in trading showing impulse moves and pullbacks in price action trend

Market Structure Basics: Impulse, Pullback, Momentum & Climax (A Trader’s Real Learning Experience)

March 16, 2026
The Beast Trader

© 2026 The Beast Trader - All Rights Reserved. Educational Price Action & Professional Trading Strategies Platform. The Beast Trader.

Navigate Site

  • Home
  • Privacy Policy
  • Contact Us
  • About Us

Follow Us

Welcome Back!

Login to your account below

Forgotten Password? Sign Up

Create New Account!

Fill the forms below to register

All fields are required. Log In

Retrieve your password

Please enter your username or email address to reset your password.

Log In
No Result
View All Result
  • Home
  • Price Action
    • Foundations
      • Basics Of Market
    • Core Price Action Structure
      • Foundations Of Price Action
      • Understandind Support & Resistance like a pro
      • Market Structure & Phases
      • Trending vs Sideways
    • Candlestick Trading Mastery
      • Complete Candlestick Trading Blueprint
      • Advance Candlestick Interpretation
    • High Probability Patterns
      • A. Major Reversal Structure
      • B. Continuation Patterns
      • C. Neutral & Compression Patterns
    • Indicators With Price Action
      • Moving Averages With Price Action
      • Volume Analysis In Price Action
      • RSI & Bollinger Bands Confirmation
    • Professional Trade Management
      • Professional Risk Management Framework
      • Position Sizing Mastery
      • Trailing Stop Techniques
      • Re-Entries & Partial Exits
    • Real Market Applications & Case Studies
  • Indian Stocks
  • Gold & Commodities
  • Markets
  • Technical Analysis
  • Forex
  • Contact Us
  • Calculator

© 2026 The Beast Trader - All Rights Reserved. Educational Price Action & Professional Trading Strategies Platform. The Beast Trader.