The Wyckoff Cycle is a market theory that explains how financial markets move through four repeating phases: Accumulation, Mark-Up, Distribution, and Markdown. Developed by legendary trader Richard D. Wyckoff, this concept helps traders understand how smart money (institutional investors) quietly accumulate assets, push prices higher, distribute holdings to retail traders, and eventually trigger market declines. By learning to identify these phases, traders can better predict market trends, trading opportunities, and potential reversals in stocks, forex, and cryptocurrency markets.

If you really want to understand how the market moves, you need to stop looking only at indicators and start understanding who is actually moving the market.
Most beginners believe that price moves randomly.
But in reality, markets often move in a structured cycle driven by institutional money, also known as smart money.
One of the most powerful frameworks to understand this behavior is called the Wyckoff Cycle.
In this guide, I’m going to explain the Wyckoff Cycle to you the same way I explain it to my students — in a simple, practical way that you can actually use in trading.
By the end of this article, you will understand:
- How smart money accumulates positions
- How trends actually start
- Why retail traders often buy at the top
- And how to identify high probability trading opportunities
Who Created the Wyckoff Method?

Before we understand the cycle, it’s important to know where this concept came from.
The Wyckoff Method was developed by Richard D. Wyckoff (1873–1934), one of the pioneers of technical analysis.
He is considered one of the five titans of technical analysis, alongside:
- Charles Dow
- W.D. Gann
- Ralph Nelson Elliott
- Richard Wyckoff
- Merrill
Wyckoff started working in the stock market at the age of 15 as a stock runner in New York. Over time, he became a successful trader, market observer, and educator.
He carefully studied the behavior of legendary traders like:
- J.P. Morgan
- Jesse Livermore
From these observations, he discovered that markets were not random at all.
Instead, large institutions were strategically accumulating and distributing shares, and retail traders were usually reacting too late.
To explain this behavior, Wyckoff introduced a concept known as the Composite Man.
The Composite Man Theory
Wyckoff suggested that traders should imagine that the entire market is controlled by one powerful operator, which he called the Composite Man.
Think of it like this:
The Composite Man represents the combined power of large institutions, hedge funds, and smart money traders.
This operator:
- Accumulates shares quietly
- Pushes prices higher
- Sells to the public at higher prices
- Then drives prices back down
If you understand this behavior, you can trade alongside smart money instead of against it.
And this is exactly where the Wyckoff Cycle comes in.
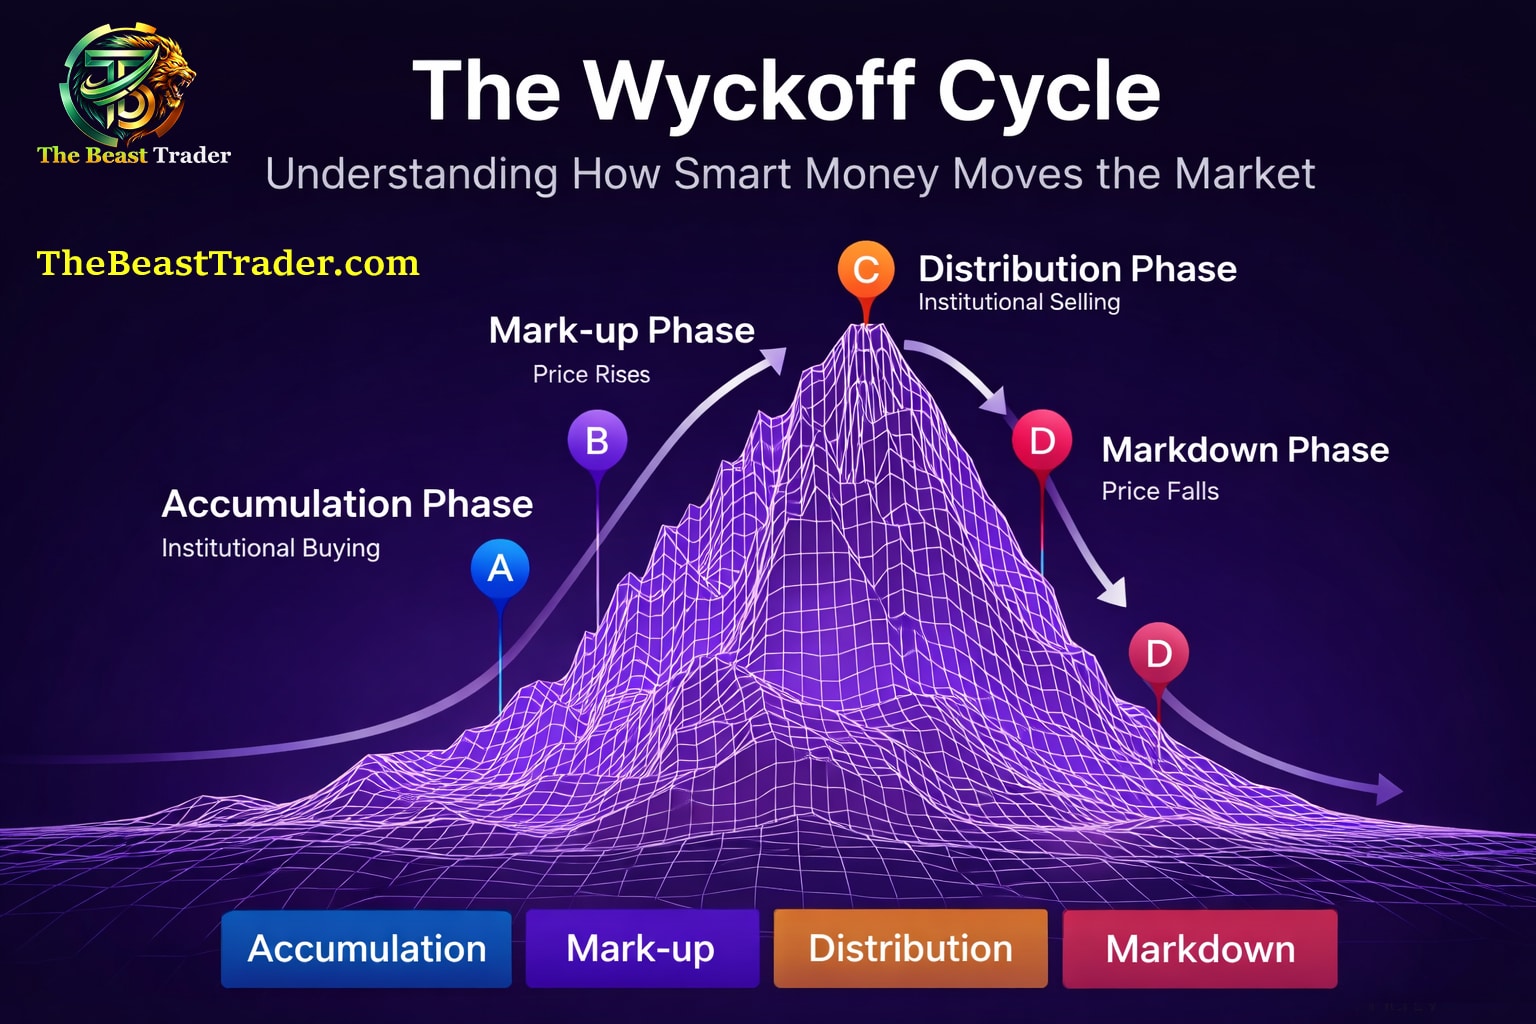
What Is the Wyckoff Cycle?
The Wyckoff Cycle describes how markets move through four repeating phases driven by supply and demand.
These phases explain how smart money enters, moves, and exits the market.
The four phases are:
- Accumulation
- Mark-Up
- Distribution
- Markdown
Understanding these phases allows traders to determine where the market currently stands in the cycle.
And that alone can dramatically improve your trading decisions.
Let’s break down each phase.
Phase 1 – Accumulation (Smart Money Starts Buying)
What Happens in the Accumulation Phase?
The Accumulation Phase usually appears after a strong market downtrend.
At this point, most retail traders are still fearful and selling their positions.
But smart money starts doing the opposite.
Large institutions begin quietly accumulating shares at lower prices without pushing the market up too quickly.
Key Characteristics of Accumulation
During this phase you will often see:
- Sideways price movement
- Low volatility
- Strong support zones
- Clear trading ranges
- Selling pressure gradually decreasing
Price typically moves within a narrow range, forming a base before the next major move.
What Smart Money Is Doing
While the public believes the market is weak, institutions are:
- Slowly absorbing supply
- Building large positions
- Preparing for the next bullish trend
This phase is where patient traders look for buying opportunities.
Phase 2 – Mark-Up (The Trend Begins)
What Happens in the Mark-Up Phase?
Once smart money has accumulated enough positions, the market enters the Mark-Up Phase.
This is where the actual bullish trend begins.
Demand increases, buyers become aggressive, and price starts moving higher.
Usually, this phase begins with a breakout from the accumulation range.
Key Characteristics of the Mark-Up Phase
You will often see:
- Breakout above resistance
- Higher highs and higher lows
- Increasing trading volume
- Strong bullish momentum
This is the phase where trend followers and momentum traders thrive.
Why Retail Traders Enter Here
Many retail traders finally start buying during this phase because the trend becomes obvious and exciting.
However, smart money already bought much earlier during accumulation.
Phase 3 – Distribution (Smart Money Starts Selling)
What Happens in the Distribution Phase?
After a strong uptrend, the market eventually enters the Distribution Phase.
This phase is where smart money begins selling the positions they accumulated earlier.
But they don’t sell all at once.
Instead, they distribute their shares gradually while the public is still buying.
Key Characteristics of Distribution
During distribution you may notice:
- Sideways consolidation at the top
- Decreasing momentum
- False breakouts
- Temporary upward spikes
- Increased selling pressure
To inexperienced traders, the market may still look bullish.
But in reality, institutions are exiting their positions.
What Smart Money Is Doing
At this stage, institutions are:
- Selling shares at premium prices
- Transferring risk to retail traders
- Preparing for the next market decline
This is often where many traders unknowingly buy near the top.
Phase 4 – Markdown (The Downtrend Begins)
What Happens in the Markdown Phase?
Once distribution is complete, the market enters the Markdown Phase.
This is when supply overwhelms demand and prices begin to fall sharply.
Retail traders who bought near the top start to panic.
Key Characteristics of Markdown
You will typically observe:
- Sharp price declines
- Lower highs and lower lows
- Panic selling
- Strong downward momentum
Another important feature is that previous support levels often turn into resistance.
The market eventually continues falling until it reaches a point where smart money begins accumulating again.
And the entire cycle repeats.
The Five-Step Wyckoff Approach to Trading
Wyckoff didn’t just describe market cycles — he also created a structured method to trade them.
His trading framework includes a five-step process for analyzing markets.
Step 1 – Identify the Market Trend
First, determine the current market condition.
Ask yourself:
- Is the market trending or consolidating?
- Is demand stronger than supply?
- Are we in accumulation or distribution?
Understanding the market environment helps you decide whether to:
- go long
- go short
- or stay out of the market
Step 2 – Select Strong or Weak Stocks
Next, choose stocks that move in harmony with the market trend.
For example:
In an uptrend, choose stocks that are stronger than the market.
These stocks usually:
- rise faster during rallies
- fall less during corrections
In a downtrend, look for weaker stocks that fall faster than the market.
Step 3 – Look for a Clear Cause
Wyckoff introduced the principle of Cause and Effect.
According to this idea:
The longer a stock accumulates, the larger the potential move afterward.
In other words:
The trading range creates the cause, and the breakout creates the effect.
Step 4 – Confirm Readiness to Move
Before entering a trade, check whether the stock is ready for a move.
Wyckoff suggested using several tests to confirm:
- supply has been absorbed
- demand is increasing
- the trend is about to begin
This helps avoid entering trades too early.
Step 5 – Align with the Overall Market
One of Wyckoff’s most important observations was:
Most stocks move with the overall market.
In fact, about 75% of stocks follow the general market trend.
That means your trading success improves significantly when your trade aligns with the broader market direction.
Why Understanding the Wyckoff Cycle Is So Important
When traders ignore market cycles, they often:
- buy near the top
- sell near the bottom
- get trapped in false breakouts
But when you understand the Wyckoff Cycle, you can start thinking like smart money instead of retail traders.
You learn to:
- Identify accumulation zones
- Enter trades before trends begin
- Avoid buying during distribution
- Protect capital during markdown phases
In simple terms, the Wyckoff Method teaches you how the market actually operates behind the scenes.
Final Thoughts
The Wyckoff Cycle is not just a theory — it’s a powerful way to understand how institutional traders move the market.
Every major market trend usually passes through these four stages:
- Accumulation
- Mark-Up
- Distribution
- Markdown
Once you start recognizing these phases on your charts, you’ll notice that market movements begin to make far more sense.
Instead of reacting emotionally to price moves, you’ll start seeing the bigger picture of supply, demand, and smart money behavior.
And that’s exactly what separates consistent traders from the crowd.
Written By :-
Arvind Singh (The Beast Trader)


Thats nyc explanation .