
Understanding how price moves is the foundation of every financial market. Whether you trade stocks, forex, indices, or cryptocurrencies, everything ultimately revolves around price movement. Every strategy, indicator, and trading system is derived from price.
Before learning advanced trading concepts, it is essential to understand three core ideas:
- What price actually represents in the market
- Why prices move up or down
- What traders mean by Price Action Trading
This chapter explains these concepts in a simple and professional way so that beginners can clearly understand how markets operate.
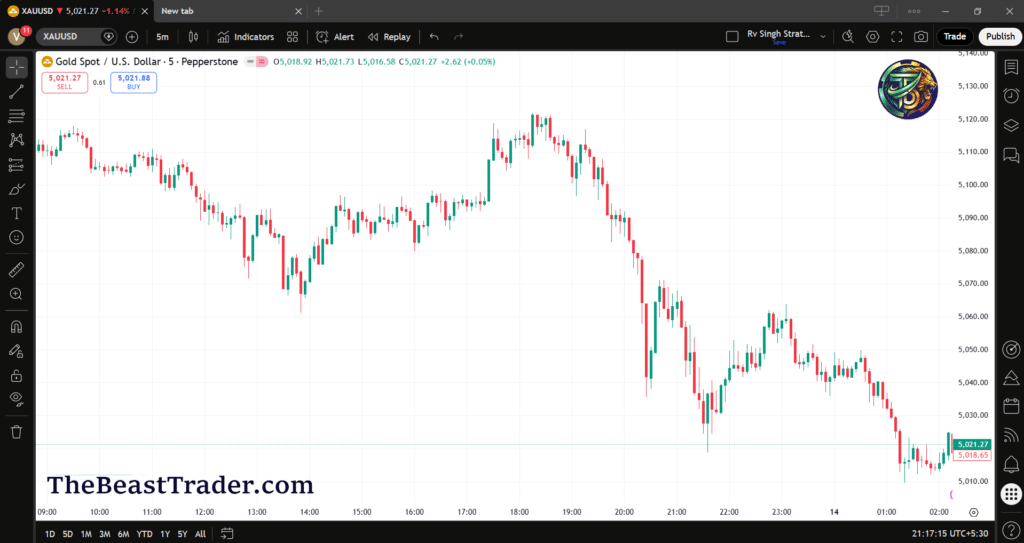
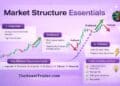
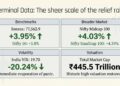
Chart Above is XAU/USD (GOLD), 5min. Chart time frame Which shows a clear picture of price movement of the Index in a simple manner.
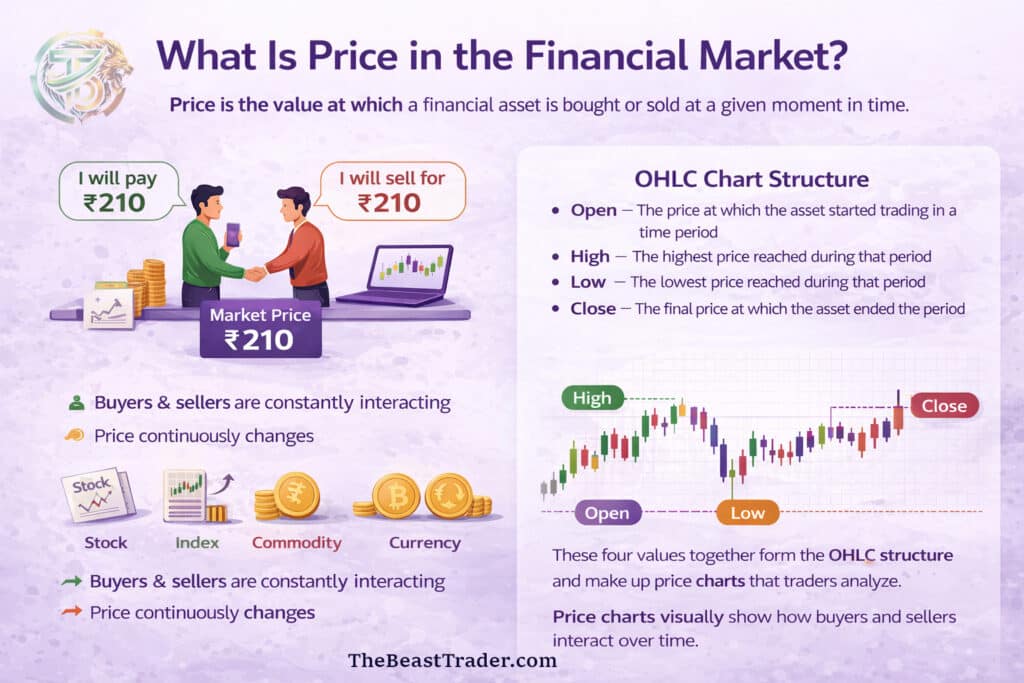
What Is Price in the Financial Market?
In financial markets, price refers to the value at which a financial asset is bought or sold at a given moment in time.
A stock, index, commodity, or currency pair does not have a fixed value. Its price continuously changes because buyers and sellers are constantly interacting in the market.
When a buyer is willing to purchase an asset and a seller is willing to sell it at a particular level, a trade takes place. The agreed value becomes the market price.
In trading charts, price is usually represented through the following four data points:
- Open – The price at which the asset started trading in a time period
- High – The highest price reached during that period
- Low – The lowest price reached during that period
- Close – The final price at which the asset ended the period
These four values together form the OHLC structure, which is used to build candlestick or bar charts that traders analyze.
Price charts are therefore a visual representation of how buyers and sellers interact over time.
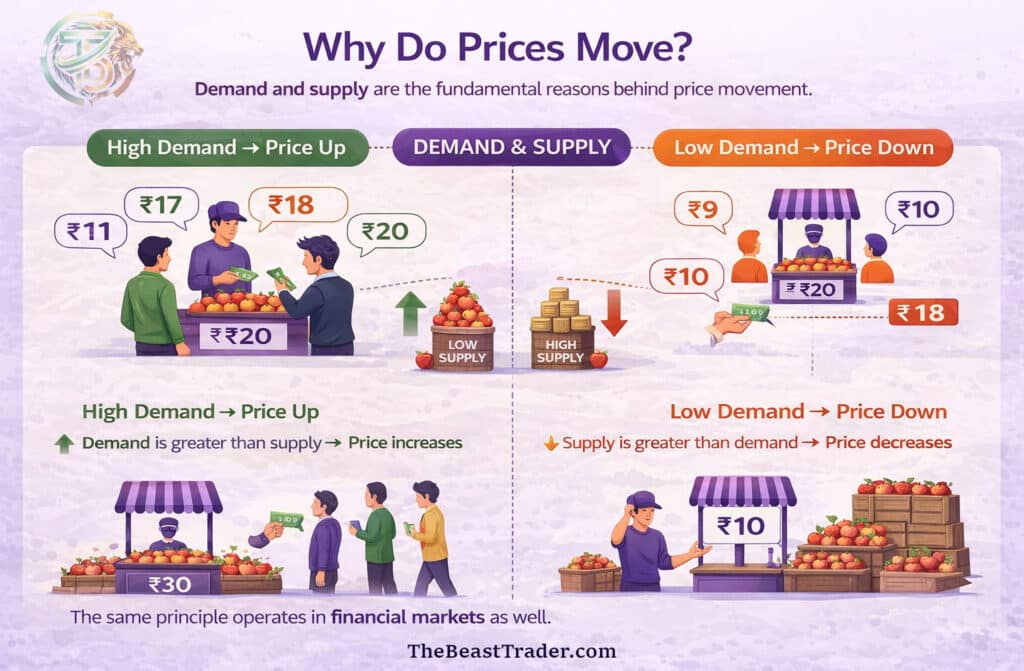
Why Do Prices Move?
The most fundamental reason behind price movement is demand and supply.
When demand for an asset increases, prices rise. When supply increases, prices fall.
To understand this concept clearly, consider a simple real-world example.
Imagine a street vendor selling apples for ₹30 each. A buyer might initially offer ₹10, which the vendor refuses. Eventually, both parties may agree on ₹18. That agreed value becomes the transaction price.
Now imagine many people suddenly want to buy apples from that vendor. Because demand is high, buyers may offer higher prices. The vendor will naturally sell to the highest bidder.
In this situation:
Demand is greater than supply, so the price increases.
On the other hand, if the vendor has a large number of apples but only a few buyers, he may have to reduce the price in order to sell them.
In this case:
Supply is greater than demand, so the price decreases.
This exact principle operates in financial markets as well.
Buyers, Sellers, and Market Pressure
In the stock market, buyers and sellers constantly place orders at different prices.
Buyers place bid orders, which represent the price they are willing to pay. Sellers place ask orders, which represent the price they are willing to accept.
A trade happens when the highest bid from a buyer matches the lowest ask from a seller.
When more buyers enter the market and compete to purchase an asset, they begin offering higher prices. This creates bullish pressure, which pushes the market upward.
When more sellers enter the market and begin selling aggressively, they accept lower prices to exit their positions. This creates bearish pressure, which pushes the market downward.
Key Market Principle
Price movement is simply the result of an imbalance between buyers and sellers.
More buyers than sellers → Price rises
More sellers than buyers → Price falls
Core Trading Principle
Price never moves randomly.
Every price movement reflects the battle between demand and supply in the market.
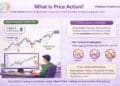
What Is Price Action?
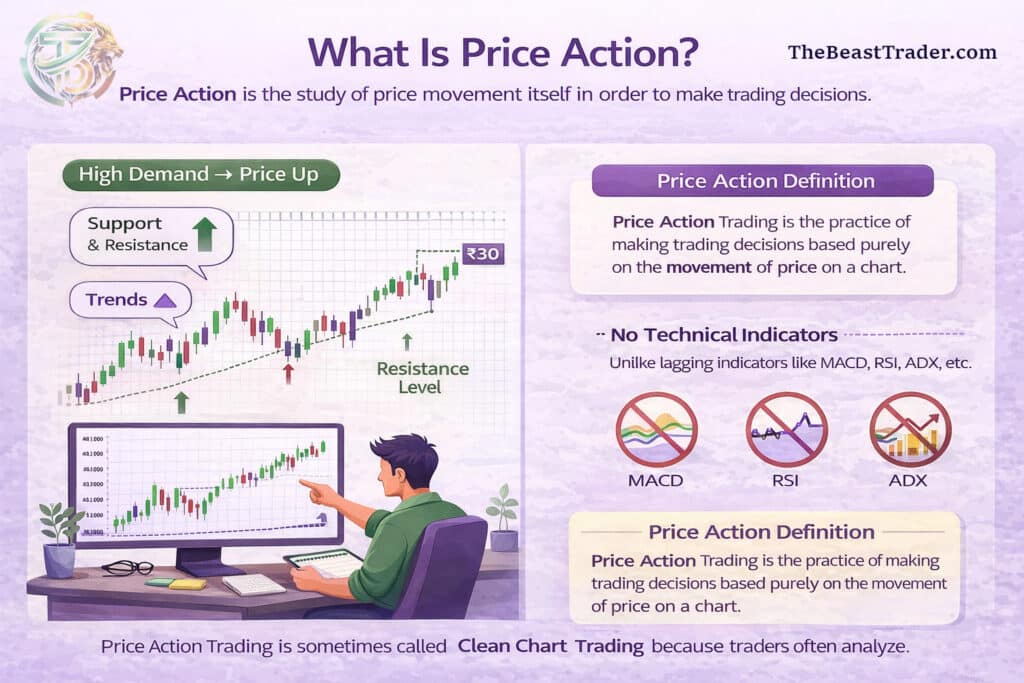
Price Action refers to the study of price movement itself in order to make trading decisions.
Instead of relying heavily on technical indicators, price action traders analyze the raw price chart to understand market behavior.
This approach focuses on observing how price moves, reacts, and forms patterns over time.
Price Action Trading is sometimes called Clean Chart Trading because traders often analyze charts with very few or no indicators.
The primary goal is to understand what the market is doing right now, rather than trying to calculate signals from lagging indicators.
Callout Box – Price Action Definition
Price Action Trading is the practice of making trading decisions based purely on the movement of price on a chart.
What Do Price Action Traders Analyze?
Price Action traders mainly focus on the following elements of the chart.
Candlestick Charts
Candlestick charts display the open, high, low, and close values of each time period. These candlesticks reveal important information about market sentiment.
Certain candlestick formations indicate potential reversals or continuation patterns.
Some commonly studied candlestick patterns include:
- Hammer
- Engulfing pattern
- Doji
- Shooting star
- Marubozu
These patterns provide insight into whether buyers or sellers are currently dominating the market.
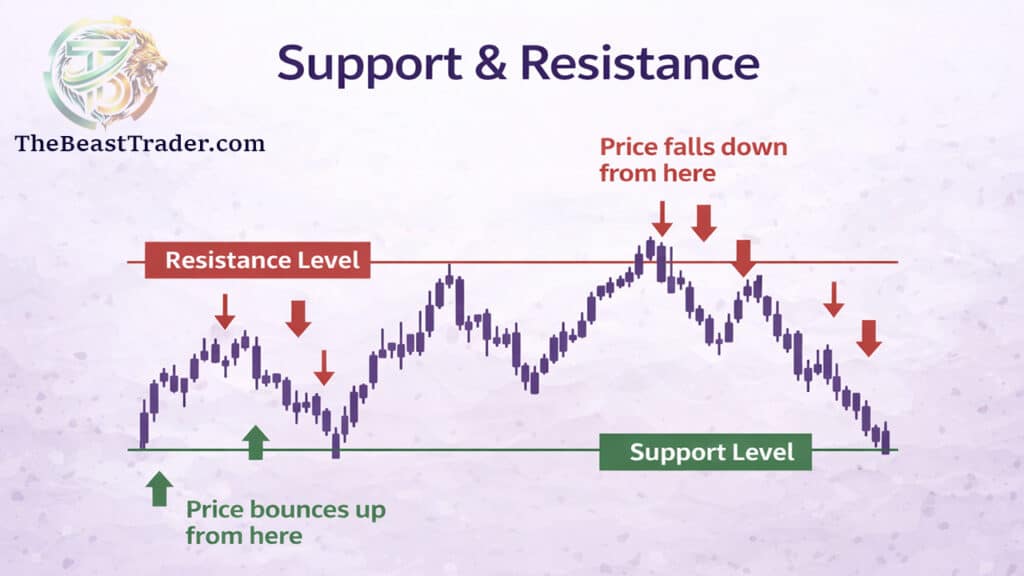
Support and Resistance
Support and resistance are key price levels where the market tends to react repeatedly.
Support is a level where buying pressure tends to increase, preventing price from falling further.
Resistance is a level where selling pressure tends to increase, preventing price from rising further.
These levels help traders identify potential entry and exit points.
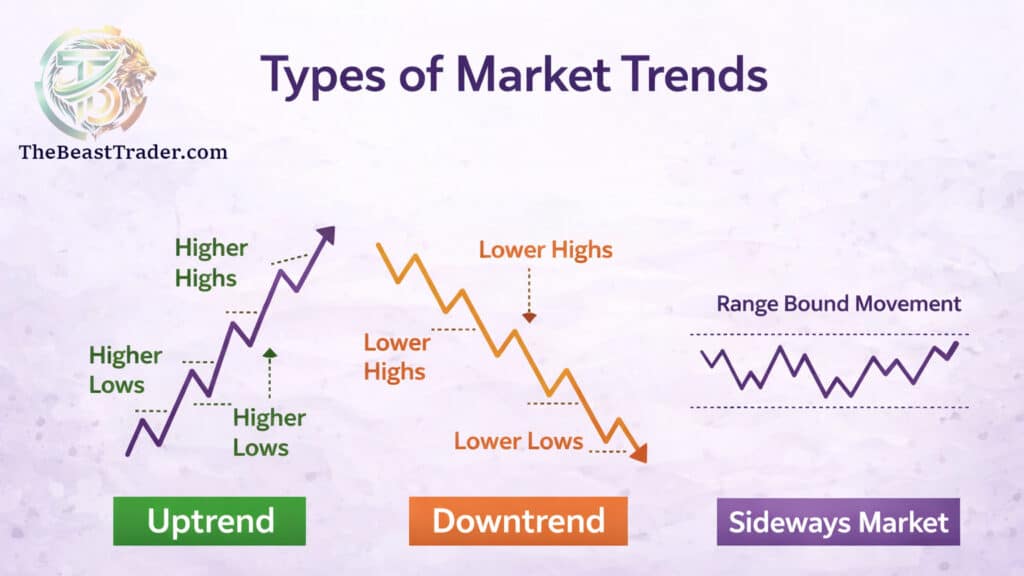
Market Trends
Markets move in trends, and identifying the trend is one of the most important skills for traders.
There are three basic market conditions:
Uptrend
An uptrend occurs when price forms higher highs and higher lows.
Downtrend
A downtrend occurs when price forms lower highs and lower lows.
Sideways Market
A sideways market occurs when price moves within a range without forming a clear trend.
Understanding the trend helps traders align their trades with the overall market direction.
Market Reaction
Another key concept in price action trading is observing how price reacts at important levels.
Two common reactions are:
Price Rejection
Price touches a level but quickly moves away from it, indicating that the market rejected that price.
Price Acceptance
Price stays above or below a level for a longer time, indicating that the market accepts that value.
These reactions often signal the strength or weakness of a trend.
Market Structure
Market structure refers to the overall pattern of price movement in the chart.
By analyzing market structure, traders determine whether the market is:
- Trending upward
- Trending downward
- Consolidating within a range
Understanding structure helps traders anticipate potential market movements.
Advantages of Price Action Trading
Price Action Trading offers several advantages.
Real-Time Market Understanding
Since price action focuses on price itself rather than lagging indicators, traders can analyze the market in real time.
Simplicity
Price action keeps charts clean and simple. Instead of relying on multiple indicators, traders focus on the most important element — price.
Clear Entry and Exit Points
Support, resistance, and market structure help traders identify logical areas for entering and exiting trades.
Time-Tested Concepts
Price action principles such as trends and support-resistance have been observed in markets for decades and remain widely used by professional traders.
Limitations of Price Action Trading
Like any trading approach, price action trading also has limitations.
Different Interpretations
Different traders may interpret the same chart in different ways. What appears bullish to one trader may appear bearish to another.
False Signals
No trading method guarantees perfect accuracy. Price action setups can sometimes produce false signals, especially in volatile markets.
Because of this, risk management and discipline are essential.
Price Action vs Indicator-Based Trading
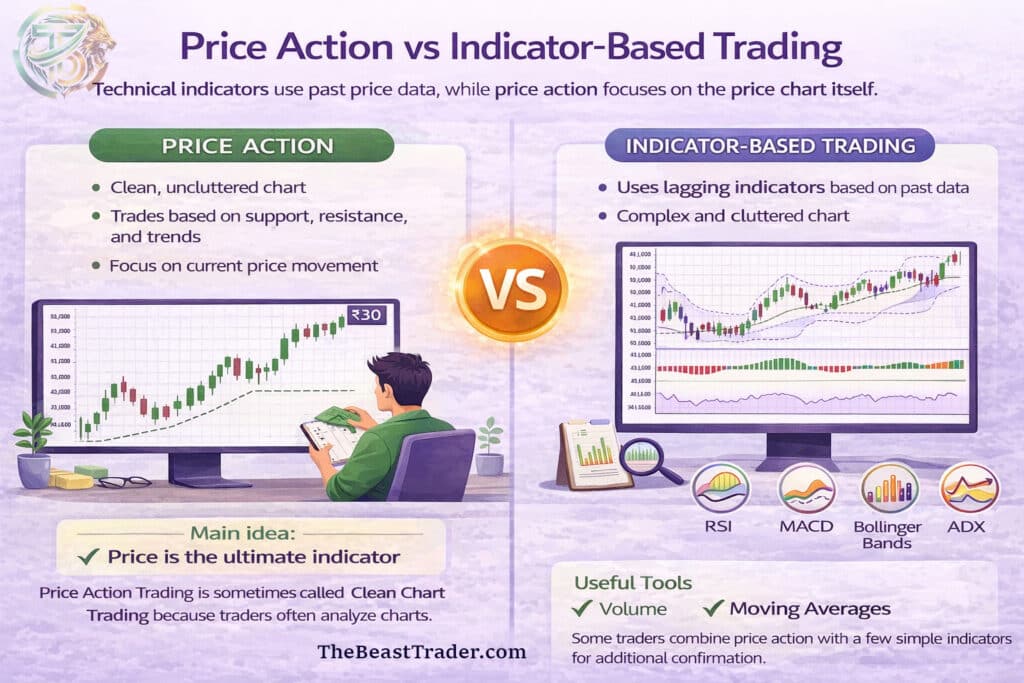
Technical indicators such as RSI, MACD, Bollinger Bands, and ADX are derived from past price data. For this reason, they are often considered lagging tools.
Price action traders believe that the price chart itself already contains all the necessary information.
However, many traders combine price action with a few simple indicators such as:
- Volume
- Moving averages
These tools can provide additional confirmation without cluttering the chart.
Final Thoughts
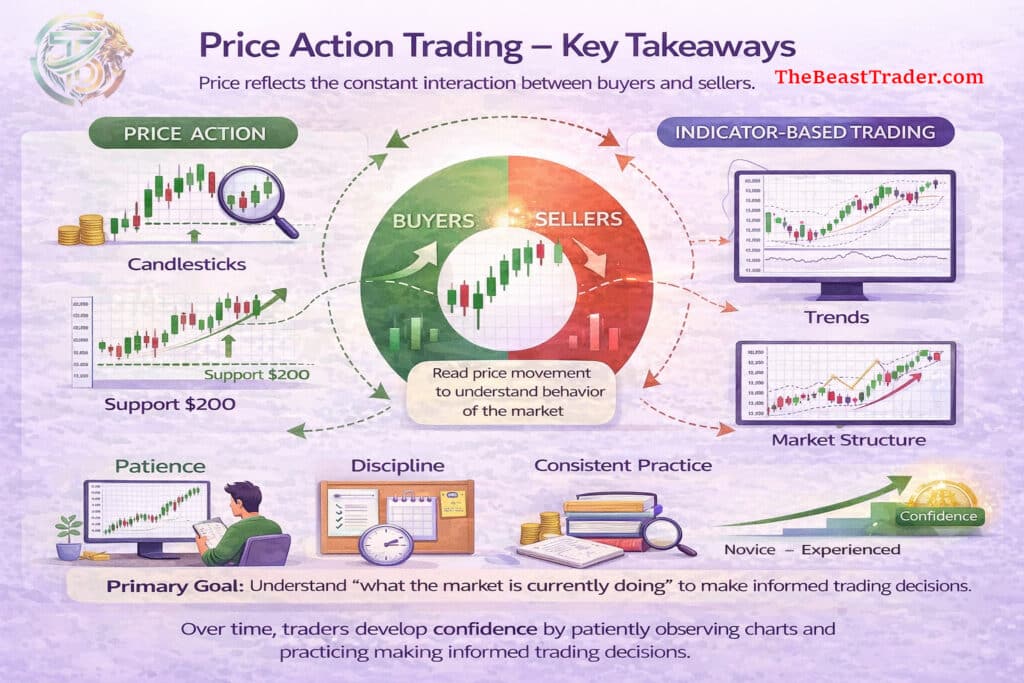
Price Action Trading is built on one simple truth: price reflects the interaction between buyers and sellers.
When buyers dominate the market, prices rise. When sellers dominate, prices fall.
By learning to read price movement through candlesticks, support and resistance, trends, and market structure, traders can gain a deeper understanding of how markets behave.
However, success in trading does not come overnight. Price action trading requires patience, discipline, and consistent practice.
The goal is not to predict every market movement but to understand what the market is currently doing and make informed trading decisions.
Over time, as traders observe more charts and develop experience, they gradually build confidence and improve their ability to interpret price behavior.
Written By
Arvind Singh (The Beast Trader)


